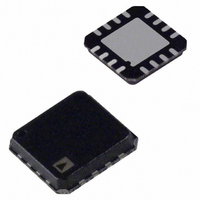
AD8318ACPZ-REEL7 Analog Devices Inc, AD8318ACPZ-REEL7 Datasheet - Page 16

AD8318ACPZ-REEL7
Manufacturer Part Number
AD8318ACPZ-REEL7
Description
IC, LOGARITHMIC AMP, 12NS, LFCSP-16
Manufacturer
Analog Devices Inc
Datasheet
1.AD8318ACPZ-REEL7.pdf
(24 pages)
Specifications of AD8318ACPZ-REEL7
No. Of Amplifiers
1
Dynamic Range, Decades
70
Response Time
12ns
Supply Voltage Range
4.5V To 5.5V
Amplifier Case Style
LFCSP
No. Of Pins
16
Supply Current
68mA
Design Resources
Stable, Closed-Loop Automatic Power Control for RF Appls (CN0050) Software Calibrated, 1 MHz to 8 GHz, 70 dB RF Power Measurement System Using AD8318 (CN0150)
Frequency
1MHz ~ 8GHz
Rf Type
RADAR, 802.11/Wi-Fi, 8.2.16/WiMax, Wireless LAN
Input Range
-60dBm ~ -2dBm
Accuracy
±1dB
Voltage - Supply
4.5 V ~ 5.5 V
Current - Supply
68mA
Package / Case
16-VQFN, CSP Exposed Pad
Rohs Compliant
Yes
Lead Free Status / RoHS Status
Lead free / RoHS Compliant
Other names
AD8318ACPZ-REEL7
AD8318ACPZ-REEL7TR
AD8318ACPZ-REEL7TR
Available stocks
Company
Part Number
Manufacturer
Quantity
Price
Company:
Part Number:
AD8318ACPZ-REEL7
Manufacturer:
FREESCALE
Quantity:
101
AD8318
Using the equation for the ideal output voltage (see Equation 13) as
a reference, the log conformance error of the measured data can
be calculated as
Figure 32 includes a plot of the error at 25°C, the temperature at
which the log amp is calibrated. Note that the error is not zero.
This is because the log amp does not perfectly follow the ideal
V
error at the calibration points (−12 dBm and −52 dBm, in this
case) is, however, equal to 0 by definition.
Figure 32 includes error plots for the output voltage at −40°C
and +85°C. These error plots are calculated using the slope
and intercept at 25°C. This method is consistent with a mass-
production environment where calibration at temperature is
not practical.
SELECTING CALIBRATION POINTS TO IMPROVE
ACCURACY OVER A REDUCED RANGE
In some applications, very high accuracy is required at just one
power level or over a reduced input range. For example, in a
wireless transmitter, the accuracy of the high power amplifier
(HPA) is most critical at, or close to, full power.
Figure 33 shows the same measured data as Figure 32. Note
that accuracy is very high from −10 dBm to −30 dBm. Below
−30 dBm, the error increases to about −1 dB. This is because
the calibration points have changed to −14 dBm and −26 dBm.
Calibration points are chosen to suit the application at hand. In
general, the calibration points are never chosen in the nonlinear
portion of the transfer function of the log amp (above −5 dBm
or below −60 dBm, in this case).
V
V
OUT2
OUT1
OUT
Figure 33. Output Voltage and Error vs. P
Error (dB) = (V
vs. P
2.2
2.0
1.8
1.6
1.4
1.2
1.0
0.6
0.4
0.2
IN
–65 –60 –55 –50 –45 –40 –35 –30
equation, even within its operating region. The
OUT(MEASURED)
−10 dBm and −30 dBm
P
IN
− V
(dBm)
V
V
V
OUT
OUT
OUT
P
OUT(IDEAL)
IN2
IN
+25°C
–40°C
+85°C
with 2-Point Calibration at
–20
P
)/Slope
IN1
–10 –5
ERROR +25°C
ERROR –40°C
ERROR +85°C
0
5
2.5
2.0
1.5
1.0
0.5
0
–0.5
–1.0
–1.5
–2.0
–2.5
(18)
Rev. B | Page 16 of 24
Figure 34 shows how calibration points can be adjusted to
increase dynamic range but at the expense of linearity. In this
case, the calibration points for slope and intercept are set at
−4 dBm and −60 dBm. These points are at the end of the linear
range of the device.
Once again, at 25°C, an error of 0 dB is seen at the calibration
points. Note also that the range over which the AD8318
maintains an error of < ±1 dB is extended to 60 dB at 25°C and
58 dB over temperature. The disadvantage of this approach is
that linearity suffers, especially at the top end of the input range.
Another way of presenting the error function of a log amp
detector is shown in Figure 35. In this case, the dB error at hot
and cold temperatures is calculated with respect to the output
voltage at ambient. This is a key difference in comparison to the
plots in Figure 33 and Figure 34. Previously, all errors were
calculated with respect to the ideal transfer function at ambient.
When this alternative technique is used, the error at ambient
becomes, by definition, equal to 0 (see Figure 35). This is valid
if the device transfer function perfectly follows the ideal
V
log amp in practice never perfectly follows this equation
(especially outside of its linear operating range), this plot tends
to artificially improve linearity and extend the dynamic range.
This plot is a useful tool for estimating temperature drift at a
particular power level with respect to the (nonideal) output
voltage at ambient. However, to achieve this level of accuracy in
an end application requires calibration at multiple points in the
operating range of the device.
OUT
Figure 34. Dynamic Range Extension by Choosing Calibration Points
2.2
2.0
1.8
1.6
1.4
1.2
1.0
0.8
0.6
0.4
0.2
= Slope × (P
–65 –60 –55 –50 –45 –40 –35 –30 –25 –20 –15 –10 –5
58dB DYNAMIC RANGE (±1dB ERROR)
Close to the End of the Linear Range
IN
− Intercept) equation. However, because a
V
V
V
OUT
OUT
OUT
+25°C
–40°C
+85°C
P
IN
(dBm)
ERROR +25°C
ERROR –40°C
ERROR +85°C
0
5
2.5
2.0
1.5
1.0
0.5
0
–0.5
–1.0
–1.5
–2.0
–2.5


