MJE13007G ON Semiconductor, MJE13007G Datasheet - Page 7
MJE13007G
Manufacturer Part Number
MJE13007G
Description
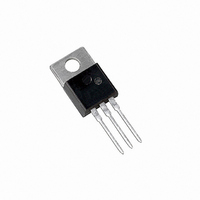
TRANS PWR NPN 8A 400V TO220AB
Manufacturer
ON Semiconductor
Series
SWITCHMODE™r
Type
Powerr
Specifications of MJE13007G
Transistor Type
NPN
Current - Collector (ic) (max)
8A
Voltage - Collector Emitter Breakdown (max)
400V
Vce Saturation (max) @ Ib, Ic
3V @ 2A, 8A
Current - Collector Cutoff (max)
100µA
Dc Current Gain (hfe) (min) @ Ic, Vce
5 @ 5A, 5V
Power - Max
80W
Frequency - Transition
14MHz
Mounting Type
Through Hole
Package / Case
TO-220-3 (Straight Leads)
Transistor Polarity
NPN
Mounting Style
Through Hole
Collector- Emitter Voltage Vceo Max
400 V
Emitter- Base Voltage Vebo
9 V
Maximum Dc Collector Current
8 A
Power Dissipation
80 W
Maximum Operating Temperature
+ 150 C
Continuous Collector Current
8 A
Dc Collector/base Gain Hfe Min
8
Maximum Operating Frequency
14 MHz
Minimum Operating Temperature
- 65 C
Current, Collector
8 A
Current, Gain
30
Frequency
14 MHz
Package Type
TO-220AB
Polarity
NPN
Primary Type
Si
Resistance, Thermal, Junction To Case
1.56 °C/W
Voltage, Breakdown, Collector To Emitter
400 V
Voltage, Collector To Emitter
400 V
Voltage, Collector To Emitter, Saturation
3 V
Voltage, Emitter To Base
9 V
Number Of Elements
1
Collector-emitter Voltage
400V
Emitter-base Voltage
9V
Collector Current (dc) (max)
8A
Dc Current Gain (min)
8
Frequency (max)
14MHz
Operating Temp Range
-65C to 150C
Operating Temperature Classification
Military
Mounting
Through Hole
Pin Count
3 +Tab
Lead Free Status / RoHS Status
Lead free / RoHS Compliant
Other names
MJE13007GOS


VOLTAGE REQUIREMENTS (continued)
shown in relation to the pulsed forward and reverse biased
SOA curves.
diodes shown. In circuits B and C the voltage is clamped by
the output rectifiers, however, the voltage induced in the
primary leakage inductance is not clamped by these diodes
and could be large enough to destroy the device. A snubber
network or an additional clamp may be required to keep the
turn−off load line within the Reverse Bias SOA curve.
curve during turn−on and within the reverse bias SOA curve
during turn−off are considered safe, with the following
assumptions:
CURRENT REQUIREMENTS
required current level with good fall time, high energy
handling capability and low saturation voltage. On this data
sheet, these parameters have been specified at 5.0 amperes
which represents typical design conditions for these devices.
The current drive requirements are usually dictated by the
V
voltage is specified at a forced gain condition which must be
duplicated or exceeded in the application to control the
saturation voltage.
SWITCHING REQUIREMENTS
transistor power dissipation occurs during the fall time (t
For this reason considerable effort is usually devoted to
reducing the fall time. The recommended way to accomplish
this is to reverse bias the base−emitter junction during
turn−off. The reverse biased switching characteristics for
inductive loads are shown in Figures 12 and 13 and resistive
loads in Figures 10 and 11. Usually the inductive load
components will be the dominant factor in SWITCHMODE
applications and the inductive switching data will more
closely represent the device performance in actual
application. The inductive switching characteristics are
derived from the same circuit used to specify the reverse
biased SOA curves, (see Table 1) providing correlation
between test procedures and actual use conditions.
CE(sat)
In the four application examples (Table 2) load lines are
In circuits A and D, inductive reactance is clamped by the
Load lines that fall within the pulsed forward biased SOA
An efficient switching transistor must operate at the
In many switching applications, a major portion of the
(see standard pulsed forward SOA curves in Figure 6).
limits shown on the Reverse Bias SOA curve (Figure 7).
2. The turn−on time does not exceed 10 ms
3. The base drive conditions are within the specified
1. The device thermal limitations are not exceeded.
specification because the maximum saturation
http://onsemi.com
fi
).
7
have been defined and apply to both current and voltage
waveforms since they are in phase. However, for inductive
loads which are common to SWITCHMODE power
supplies and any coil driver, current and voltage waveforms
are not in phase. Therefore, separate measurements must be
made on each waveform to determine the total switching
time. For this reason, the following new terms have been
defined.
in Figure 12 to aid in the visual identity of these terms. For
the designer, there is minimal switching loss during storage
time and the predominant switching power losses occur
during the crossover interval and can be obtained using the
standard equation from AN222A:
In general, t
relationship may not be valid.
switching is specified at 25°C and has become a benchmark
for designers. However, for designers of high frequency
converter circuits, the user oriented specifications which
make this a “SWITCHMODE” transistor are the inductive
switching speeds (t
In resistive switching circuits, rise, fall, and storage times
t
t
t
t
t
An enlarged portion of the turn−off waveforms is shown
P
Typical inductive switching times are shown in Figure 13.
As is common with most switching transistors, resistive
sv
rv
fi
ti
c
SWT
= Crossover Time, 10% V
= Current Tail, 10−2% I
= Current Fall Time, 90−10% I
= Voltage Rise Time, 10−90% V
= Voltage Storage Time, 90% I
= 1/2 V
rv
SWITCHING TIME NOTES
+ t
CC
fi
I
≅
c
C
and t
t
(t
c
. However, at lower test currents this
c
) f
sv
) which are guaranteed at 100°C.
C
clamp
C
to 10% I
B1
clamp
to 10% V
C
clamp
Related parts for MJE13007G
Image
Part Number
Description
Manufacturer
Datasheet
Request
R

Part Number:
Description:
ON Semiconductor [VOLTAGE REGULATOR]
Manufacturer:
ON Semiconductor
Datasheet:
Part Number:
Description:
357-036-542-201 CARDEDGE 36POS DL .156 BLK LOPRO
Manufacturer:
ON Semiconductor
Datasheet:
Part Number:
Description:
357-036-542-201 CARDEDGE 36POS DL .156 BLK LOPRO
Manufacturer:
ON Semiconductor
Datasheet:
Part Number:
Description:
357-036-542-201 CARDEDGE 36POS DL .156 BLK LOPRO
Manufacturer:
ON Semiconductor
Datasheet:
Part Number:
Description:
357-036-542-201 CARDEDGE 36POS DL .156 BLK LOPRO
Manufacturer:
ON Semiconductor
Datasheet:
Part Number:
Description:
357-036-542-201 CARDEDGE 36POS DL .156 BLK LOPRO
Manufacturer:
ON Semiconductor
Datasheet:
Part Number:
Description:
357-036-542-201 CARDEDGE 36POS DL .156 BLK LOPRO
Manufacturer:
ON Semiconductor
Datasheet:
Part Number:
Description:
357-036-542-201 CARDEDGE 36POS DL .156 BLK LOPRO
Manufacturer:
ON Semiconductor
Datasheet:
Part Number:
Description:
357-036-542-201 CARDEDGE 36POS DL .156 BLK LOPRO
Manufacturer:
ON Semiconductor
Datasheet:
Part Number:
Description:
357-036-542-201 CARDEDGE 36POS DL .156 BLK LOPRO
Manufacturer:
ON Semiconductor
Datasheet:
Part Number:
Description:
357-036-542-201 CARDEDGE 36POS DL .156 BLK LOPRO
Manufacturer:
ON Semiconductor
Datasheet:
Part Number:
Description:
Manufacturer:
ON Semiconductor
Datasheet:
Part Number:
Description:
Manufacturer:
ON Semiconductor
Datasheet:
Part Number:
Description:
Manufacturer:
ON Semiconductor
Datasheet: