LM2412T/NOPB National Semiconductor, LM2412T/NOPB Datasheet - Page 5
LM2412T/NOPB
Manufacturer Part Number
LM2412T/NOPB
Description
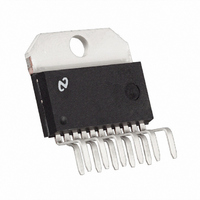
IC DRIVER MONOLITHIC TO-220-11
Manufacturer
National Semiconductor
Datasheet
1.LM2412TNOPB.pdf
(11 pages)
Specifications of LM2412T/NOPB
Display Type
CRT
Current - Supply
21mA
Voltage - Supply
60 V ~ 85 V
Operating Temperature
-20°C ~ 100°C
Mounting Type
Through Hole
Package / Case
TO-220-11 (Bent and Staggered Leads)
Lead Free Status / RoHS Status
Lead free / RoHS Compliant
Interface
-
Configuration
-
Digits Or Characters
-
Other names
*LM2412T
*LM2412T/NOPB
LM2412T
*LM2412T/NOPB
LM2412T


Application Hints
and R2 will slow the circuit down while decreasing over-
shoot. Increasing the value of L1 will speed up the circuit as
well as increase overshoot. It is very important to use induc-
tors with very high self-resonant frequencies, preferably
above 300 MHz. Air core inductors from J.W. Miller Magnet-
ics (part #75F518MPC) were used for optimizing the perfor-
mance of the device in the NSC application board. The
values shown in Figure 9 can be used as a good starting
point for the evaluation of the LM2412.
Effect of Load Capacitance
The output rise and fall times as well as overshoot will vary
as the load capacitance varies. The values of the output
circuit (R1, R2 and L1 in Figure 9 ) should be chosen based
on the nominal load capacitance. Once this is done the
performance of the design can be checked by varying the
load based on what the expected variation will be during
production.
Effect of Offset
Figure 7 shows the variation in rise and fall times when the
output offset of the device is varied from 35 to 55 V
rise and fall times show about the same overall variation.
The slightly slower fall time is fastest near the center point of
45V, making this the optimum operating point. At the low and
high output offset range, the characteristic of rise/fall time is
slower due to the saturation of Q3 and Q4. The recovery
time of the output transistors takes longer coming out of
saturation thus slows down the rise and fall times.
THERMAL CONSIDERATIONS
Figure 4 shows the performance of the LM2412 in the test
circuit shown in Figure 2 as a function of case temperature.
Figure 4 shows that both the rise and fall times of the
LM2412 become slightly longer as the case temperature
increases from 40˚C to 125˚C. In addition to exceeding the
safe operating temperature, the rise and fall times will typi-
cally exceed 3 nsec. Please note that the LM2412 is never
to be operated over a case temperature of 100˚C. In
addition to exceeding the safe operating temperature, the
rise and fall times will typically exceed 3 nsec.
Figure 6 shows the total power dissipation of the LM2412 vs.
Frequency when all three channels of the device are driving
an 8 pF load. Typically the active time is about 72% of the
total time for one frame. Worst case power dissipation is
when a one on, one off pixel is displayed over the active time
of the video input. This is the condition used to measure the
total power disspation of the LM2412 at different input fre-
quencies. Figure 6 gives all the information a monitor de-
signer normally needs for worst case power dissipation.
However, if the designer wants to calculate the power dissi-
pation for an active time different from 72%, this can be done
using the information in Figure 14 . The recommended input
black level voltage is 1.9V. From Figure 14 , if a 1.9V input is
used for the black level, then power dissipation during the
inactive video time is 2.7W. This includes both the 80V and
12V supplies.
If the monitor designer chooses to calculate the power dis-
sipation for the LM2412 using an active video time different
from 72%, then he needs to use the following steps when
using a 1.9V input black level:
1. Multiply the black level power dissipation, 2.7W, by 0.28,
the result is 0.8W.
(Continued)
DC
. The
5
2. Choose the maximum frequency to be used. A typical
3. Subtract the 0.8W from the power dissipation from Fig-
4. Divide the result from step 3 by 0.72. For 100 MHz, the
5. Multiply the result in 4 by the new active time percent-
6. Multiply 2.7W by the new inactive time.
7. Add together the results of steps 5 and 6. This is the
The LM2412 case temperature must be maintained below
100˚C. If the maximum expected ambient temperature is
70˚C and the maximum power dissipation is 13.8W (from
Figure 6. 100MHz) then a maximum heat sink thermal resis-
tance can be calculated:
TYPICAL APPLICATION
A typical application of the LM2412 is shown in Figure 10 .
Used in conjunction with three LM2202s, a complete video
channel from monitor input to CRT cathode can be achieved.
Performance is excellent for resolutions up to 1600 x 1200
and pixel clock frequencies at 200 MHz. Figure 10 is the
schematic for the NSC demonstration board that can be
used to evaluate the LM2202/LM2412 combination in a
monitor.
PC Board Layout Considerations
For optimum performance, an adequate ground plane, iso-
lation between channels, good supply bypassing and mini-
mizing unwanted feedback are necessary. Also, the length of
the signal traces from the preamplifier to the LM2412 and
from the LM2412 to the CRT cathode should be as short as
possible. The red video trace from the buffer transistor to the
LM2412 input is about the absolute maximum length one
should consider on a PCB layout. If possible the traces
should actually be shorter than the red video trace. The
following references are recommended for video board de-
signers:
Ott, Henry W., “Noise Reduction Techniques in Electronic
Systems”, John Wiley & Sons, New York, 1976.
“Guide to CRT Video Design”, National Semiconductor Ap-
plication Note 861.
“Video Amplifier Design for Computer Monitors”, National
Semiconductor Application Note 1013.
Pease, Robert A., “Troubleshooting Analog Circuits”,
Butterworth-Heinemann, 1991.
Because of its high small signal bandwidth, the part may
oscillate in a monitor if feedback occurs around the video
channel through the chassis wiring. To prevent this, leads to
the video amplifier input circuit should be shielded, and input
circuit wiring should be spaced as far as possible from output
circuit wiring.
NSC Demonstration Board
Figures 11, 12 show routing and component placement on
the NSC LM2202/2412 demonstration board. The schematic
of the board is shown in Figure 10 . This board provides a
application would use 100 MHz, or a 200 MHz pixel
clock. The power dissipation is 13.8W.
ure 6 . For 100 MHz this would be 13.8 – 0.8 = 13.0W.
result is 18.1W.
age.
expected power dissipation for the LM2412 in the de-
signer’s application.
www.national.com
Related parts for LM2412T/NOPB
Image
Part Number
Description
Manufacturer
Datasheet
Request
R

Part Number:
Description:
Monolithic Triple 2.8 nsec Driver
Manufacturer:
National Semiconductor
Datasheet:
Part Number:
Description:
National Semiconductor [8-Bit D/A Converter]
Manufacturer:
National Semiconductor
Datasheet:
Part Number:
Description:
National Semiconductor [Media Coprocessor]
Manufacturer:
National Semiconductor
Datasheet:
Part Number:
Description:
Digitally Controlled Tone and Volume Circuit with Stereo Audio Power Amplifier, Microphone Preamp Stage and National 3D Sound
Manufacturer:
National Semiconductor
Datasheet:
Part Number:
Description:
Digitally Controlled Tone and Volume Circuit with Stereo Audio Power Amplifier, Microphone Preamp Stage and National 3D Sound
Manufacturer:
National Semiconductor
Datasheet:
Part Number:
Description:
AC97 Rev 2 Codec with Sample Rate Conversion and National 3D Sound
Manufacturer:
National Semiconductor
Part Number:
Description:
Manufacturer:
National Semiconductor
Datasheet:
Part Number:
Description:
Manufacturer:
National Semiconductor
Datasheet:
Part Number:
Description:
General Purpose, Low Voltage, Low Power, Rail-to-Rail Output Operational Amplifiers
Manufacturer:
National Semiconductor
Datasheet:
Part Number:
Description:
8-bit 20 MSPS flash A/D converter.
Manufacturer:
National Semiconductor
Datasheet:
Part Number:
Description:
Low Noise Quad Operational Amplifier
Manufacturer:
National Semiconductor
Datasheet:
Part Number:
Description:
Quad Differential Line Receivers
Manufacturer:
National Semiconductor
Datasheet:
Part Number:
Description:
Quad High Speed Trapezoidal? Bus Transceiver
Manufacturer:
National Semiconductor
Datasheet:
Part Number:
Description:
Dual Line Receiver
Manufacturer:
National Semiconductor
Datasheet: