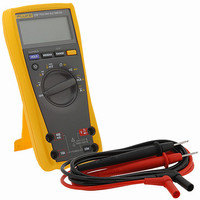
FLUKE-179 ESFP Fluke Electronics, FLUKE-179 ESFP Datasheet - Page 13

FLUKE-179 ESFP
Manufacturer Part Number
FLUKE-179 ESFP
Description
DMM TRE RMS W/TEMP 6000 CNT DIS
Manufacturer
Fluke Electronics
Series
ToolPak™, 170r
Type
Digital (DMM), Testerr
Specifications of FLUKE-179 ESFP
Includes
Battery, Temperature Probe, Test Leads
Style
Handheld
Display Digits
3.75
Display Type
LCD, Bar Graph
Display Count
6000
Function
Voltage, Current, Resistance, Capacitance, Temperature, Frequency
Functions, Extra
Continuity, Diode Test
Features
Backlight, Hold, Min/Max/Ave
Ranging
Auto/Manual
Response
True RMS
Lead Free Status / RoHS Status
Vendor undefined / RoHS compliant by exemption
Other names
1564549
179 ESFP
614-1021
179 ESFP
614-1021
Measuring Frequency
The Meter measures the frequency of a signal. The trigger level is
0 V, 0 A AC for all ranges.
AC/DC Voltage Frequency
To avoid electrical shock, disregard the bar graph for
frequencies > 1 kHz. If the frequency of the measured
signal is > 1 kHz, the bar graph is unspecified.
V
V
To exit frequency, press YELLOW button or turn the rotary
switch.
In frequency, the bar graph shows the AC/DC voltage or AC
current accurately up to 1 kHz.
Select progressively lower ranges using manual ranging for a
stable reading.
+
HOLD
MIN MAX
RANGE
X W
Hz
Warning
x 2
+
Hz
AC Current Frequency
HOLD
MIN MAX
RANGE
AIK09F.EPS
mA
A
Using the Bar Graph
The bar graph is like the needle on an analog Meter. It has an
overload indicator ( ) to the right and a polarity indicator ( ) to the
left.
Because the bar graph updates about 40 times per second, which
is 10 times faster than the digital display, the bar graph is useful
for making peak and null adjustments and for observing rapidly
changing inputs.
The bar graph is disabled when measuring capacitance or
temperature. In frequency, the bar graph accurately indicates the
voltage or current up to 1 kHz.
The number of lit segments indicates the measured value and is
relative to the full-scale value of the selected range .
In the 60 V range, for example (see below), the major divisions on
the scale represent 0, 15, 30, 45, and 60 V. An input of 30 V
lights the negative sign and the segments up to the middle of the
scale.
Using the Bar Graph
AIK11F.EPS
9


