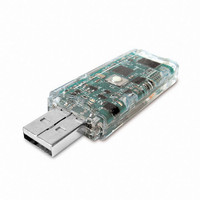
VR001 Mide Technology Corporation, VR001 Datasheet

VR001
Specifications of VR001
Related parts for VR001
VR001 Summary of contents
Page 1
... Comma‐Separated Value (.CSV) vibration data generated from Slam Stick or other sources. Refer to page 7 for formatting. Python Graphing UI | Version 1.1 ) ) www.mide.com/products/slamstick/slamstick_vr001_software.php | Slam Stick High Speed Portable Data Logger PYTHON GRAPHIC UI ) ...
Page 2
Files may be read from most any file source, including local/network drives or directly from the Slam Stick. Please note that reading from the Slam Stick is much slower than reading from a local hard drive. Additionally, depending on the speed of your computer and the size of the recording being analyzed, analysis may take a long time (up to several minutes) to complete. The GUI will appear unresponsive during this time. Slam Stick Viewer can also export the recording (time history and/or FFT) as a .CSV file for use with other programs. Refer to page 7 for formatting. Configure Menu Use the Configure menu to configure the Slam Stick. The recommended approach is to select “Edit Configuration” and point to the configuration file (config.dat) of a Slam Stick that is currently plugged in. You can also create a new Slam Stick configuration file and save it to disk ...
Page 3
WORKING WITH PLOTS Plot Toolbar The Plot Toolbar provides common options for all plot types. Figure 3 shows the available options. The toolbar buttons, from left to right, do the following: Home This button returns the plot to its original view, adjusting the axes so that the ...
Page 4
Plot Types and Plot-Specific Options Use the tabs on the left hand side to switch between different plot types. Time History The Time History plot shows acceleration in Gs as a function of time for each axis. Use the tickboxes to the right of the plot to show/hide individual axes. Python Graphing UI | Version 1.1 Figure 4: Time History view ...
Page 5
The 1‐D FFT shows the frequency distribution in Gs (approximate) over the entire recording. This view provides the highest frequency resolution, and is best suited for recordings whose frequency content does not significantly change over time. Like the time history plot, use the tickboxes at right to show/hide individual axes. The data are shown in linear scale by default. Use the ‘Log X’ and ‘Log Y’ tickboxes to switch ...
Page 6
Spectrogram (2‐D FFT) The Spectrogram plot shows the distribution of frequency content over time, sometimes called a modal survey. The recording data is divided into ¼‐second increments by default. This view is most useful for identifying time‐varying trends in the frequency content of a signal. Only one axis is shown at a time (the Z axis is shown by default). Use the radio buttons at right to switch the axis currently displayed. Python Graphing UI | Version 1.1 Figure 6: Spectrogram view | Slam Stick High Speed Portable Data Logger ...
Page 7
FILE FORMATS Native Slam Stick recordings For technical performance reasons, the Slam Stick records vibration data and its configuration in a custom binary format. Most users will not need to work with these data formats directly. Please refer to the “C” examples (available from the Slam Stick download page) for the structure of the binary recording file and configuration file. CSV Data CSV (Comma‐Separated Value) is a plain‐text format supported by common office and spreadsheet applications as well as most scientific computing packages. CSV time history data exported from the Slam Stick is saved as a list of samples in the following format: t, X, Y, Z <newline> where t is the time in seconds (the recording begins at t = 0), and X, Y, Z are the amplitudes in Gs (‐16 ~ +16) for the respective axes. <newline> will be the appropriate end‐of‐line character(s) for your operating system. Example: 0.0, 0.140625, 0.000305986308852, 0.140625, 0.000611972617703, 0.1171875, … ...
Page 8
TROUBLESHOOTING After opening a long recording, the main window is frozen! The full FFT for all axes may take a while to complete (up to several minutes), especially for longer recordings or slower computers (e.g. netbooks). If the program is still unresponsive after several minutes, please see the next item. Error messages referring to "side-by-side" or "WinSxS" configuration This error means that required Microsoft run‐time libraries are missing. This could occur on older ...
Page 9
USING AND CUSTOMIZING SLAM STICK VIEWER (PYTHON SOURCE) Executing To run the Slam Stick Viewer GUI standalone, run slamview.py without any arguments. Reading and Writing Files Slam Stick file read and write functions are provided by ss_read.py, and can be called from an external script (requires NumPy). ss_reader(parent=None, filename=None, recording_num=None) Reads a vibration file in Slam Stick native, Slam Stick ‘split’, or CSV format (depending on file extension). parent is the parent Tk window (if any). If no filename was provided, a file selection dialog will first be spawned. If a Slam Stick file contains multiple recordings and recording_num ...
Page 10
Creates plot‐specific axis controls. The default create_axis_controls, for line plots, creates checkboxes to switch between linear and logarithmic axis scales. For other plot types, this method should be overridden. update(self) – Fully updates the plot window, including rescaling of the axes. This method should be called after changing or adding new data to a plot. redraw(self) – Redraws the current plot window, but does not recompute axis scale (much faster than a full update). ...


