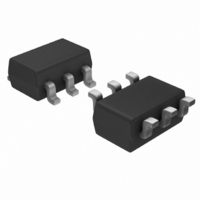
IRU3065CLTR International Rectifier, IRU3065CLTR Datasheet - Page 13

IRU3065CLTR
Manufacturer Part Number
IRU3065CLTR
Description
IC POS-NEG DC-DC CNTRLR SOT23-6
Manufacturer
International Rectifier
Type
Invertingr
Specifications of IRU3065CLTR
Internal Switch(s)
No
Synchronous Rectifier
No
Number Of Outputs
1
Voltage - Output
Adjustable
Current - Output
1A
Frequency - Switching
Adj to 1.5MHz
Voltage - Input
5V
Operating Temperature
0°C ~ 70°C
Mounting Type
Surface Mount
Package / Case
SOT-23-6
Power - Output
240mW
For Use With
IRDC3065 - LOW PWR SWTCH REG REF DESIGN KIT
Lead Free Status / RoHS Status
Contains lead / RoHS non-compliant
Available stocks
Company
Part Number
Manufacturer
Quantity
Price
Part Number:
IRU3065CLTRPBF
Manufacturer:
IR
Quantity:
20 000
When I
age V
The above equation is used to select the current sens-
ing resistor R
Substitution of equation (16) into equation (13) results
in the relationship between frequency and output cur-
rent, that is
The above equation indicates that the switching fre-
quency decreases when output current increases dur-
ing power limit mode.
When I
maximum. Substitution of V
(6) into equation (13) results in the maximum switching
frequency:
Therefore, the inductance can be selected according
to the maximum desired frequency as shown in the fol-
lowing:
Fig. 24 and Fig.25 shows the theorectical predication
and calculation results for the output voltage and fre-
quency versus output current.
I
f
f
f
L
OCP
S
S(MAX)
S(MAX)
OUT
=
OUT
OUT
=
L×I
=V
=I
=
=I
=
1
2
V
OUT(NOM)
OCP
IN
PEAK
OCP
S
×
V
.
V
, the output voltage equals nominal volt-
VI
OUT(NOM)
, the switching frequency reaches its
IN
V
R
V
V
×(V
× 1 -
IN
SEN
VI
S
IN
. From equation (15),we have
×(V
OUT(NOM)
(
×(V
SEN
×
V
(V
(V
D
OUT(NOM)
)×f
×(V
V
IN
D
- V
IN
IN
2×I
D
- V
+ V
I
)×L×I
- V
+ V
S(MAX)
PEAK
- V
OUT(NOM)
IN
OUT
OUT(NOM)
V
OUT
D
)×L
OUT(NOM)
OUT
+ V
D
IN
-
=V
×I
)
-
+V
D
--(18)
PEAK
OUT(NOM)
)×R
PEAK
-
)
D
)
S
and equation
---(17)
---(19)
---(20)
www.irf.com
Figure 24- The comparison between predicted and
Figure 25 - The comparison between predicted
measured output voltage versus output current
and measured switching frequency versus
6
5
4
3
2
1
0
1200
1000
Predicted fs(KHz)
800
600
400
200
0
Switching frequency versus output current
0
0
Predicted (-Vout)
Vout versus output current
0.2
output current
0.2
Output current (amp)
Output current (A)
IRU3065(PbF)
0.4
0.4
Experiment fs (kHz)
Measured -Vout
0.6
0.6
13
0.8
0.8


