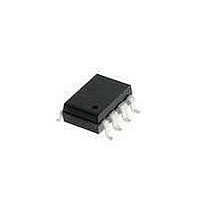
HCPL-3000-500E Avago Technologies US Inc., HCPL-3000-500E Datasheet - Page 8

HCPL-3000-500E
Manufacturer Part Number
HCPL-3000-500E
Description
OPTOCOUPLER BIPOLAR 8-SMD
Manufacturer
Avago Technologies US Inc.
Datasheet
1.HCPL-3000.pdf
(10 pages)
Specifications of HCPL-3000-500E
Output Type
Push-Pull, Totem-Pole
Package / Case
8-SMD Gull Wing
Voltage - Isolation
5000Vrms
Number Of Channels
1, Unidirectional
Current - Output / Channel
500mA
Propagation Delay High - Low @ If
2µs @ 5mA
Current - Dc Forward (if)
20mA
Input Type
DC
Mounting Type
Surface Mount, Gull Wing
Fall Time
1 us
Rise Time
1 us
Configuration
1 Channel
Isolation Voltage
5000 Vrms
Maximum Propagation Delay Time
5 us
Maximum Forward Diode Voltage
1.4 V
Maximum Reverse Diode Voltage
6 V
Maximum Forward Diode Current
20 mA
Maximum Continuous Output Current
0.6 A
Maximum Power Dissipation
550 mW
Maximum Operating Temperature
+ 80 C
Minimum Operating Temperature
- 20 C
Lead Free Status / RoHS Status
Lead free / RoHS Compliant
Figure 12. Typical peak output 2 current vs.
output 2 voltage (safe operating area Q2).
Figure 9. LED forward current vs. ambient
temperature.
Figure 15. Normalized low to high threshold
input current vs. ambient temperature.
8
10.0
30
25
20
15
10
5.0
2.0
1.0
0.5
0.2
0.1
1.6
1.4
1.2
1.0
0.8
0.6
5
0
0.2
-20
-25
I
I
02
02
DC (T = 80 C)
MAX (PULSE)
MAX (CONTINUOUS)
0
0.5
0
AMBIENT TEMPERATURE T ( C)
AMBIENT TEMPERATURE T
A
OUTPUT 2 VOLTAGE V (V)
1.0
25
25
V
100 ms•
10 ms• 1 ms•
CC
2.0
(MAX)
50
50
• SINGLE OSC.
PULSE
T = 25 C
A
02
5.0
DC
A
A
V
I •
S
CC
( C)
75
75
10.0
= 6 V
80
20.0
100
100
Figure 10. Maximum IC output power
dissipation vs. ambient temperature.
Figure 13. Typical forward current vs. forward
voltage.
Figure 16. Typical low level output 1 voltage
vs. output 1 current.
500
200
100
50
20
10
0.005
600
500
400
300
200
100
5
2
1
0.05
0.02
0.01
0.4
0.2
0.1
0
0
-20
0.01
T
50 C
25 C
0 C
-20 C
A
R
I = 5 mA
0.5
T = 25 C
V
F
0.02
= 75 C
CC
A
L2
0
AMBIENT TEMPERATURE T
= 6 V
= 10
1.0
FORWARD VOLTAGE V
OUTPUT 1 CURRENT I
0.05
25
1.5
0.1
2.0
50
0.2
2.5
F
01
A
(V)
(A)
( C)
75
3.0
80
0.5
3.5
100
1.0
Figure 11. Maximum total power dissipation
vs. ambient temperature.
Figure 14. Normalized low to high threshold
input current vs. supply voltage.
Figure 17. Typical low level output 1 voltage
vs. ambient temperature.
1.2
1.1
1.0
0.9
0.8
0.7
0.5
0.4
0.3
0.2
0.1
600
550
500
400
300
200
100
0
-25
0
4
-20
I
0.4 A
0.1 A
01
= 0.5 A
6
0
AMBIENT TEMPERATURE T ( C)
0
AMBIENT TEMPERATURE T
SUPPLY VOLTAGE V
25
8
25
10
50
50
CC
V
R
I = 5 mA
(V)
F
CC
L2
T = 25 C
A
A
= 6 V
= 10
A
( C)
12
75
75
80
100
14
100


