IRGPC40UD2 International Rectifier, IRGPC40UD2 Datasheet
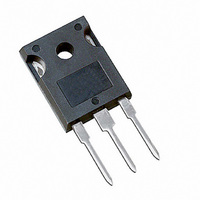
IRGPC40UD2
Specifications of IRGPC40UD2
Available stocks


Related parts for IRGPC40UD2


IRGPC40UD2 Summary of contents
Page 1
... Soldering Temperature, for 10 sec. Mounting Torque, 6- Screw. Thermal Resistance Parameter R Junction-to-Case - IGBT JC R Junction-to-Case - Diode JC R Case-to-Sink, flat, greased surface CS R Junction-to-Ambient, typical socket mount JA Wt Weight IRGPC40UD2 UltraFast CoPack IGBT n-channel Max. 600 40 20 160 160 15 160 ± 20 160 65 -55 to +150 300 (0.063 in. (1.6mm) from case) 10 lbf• ...
Page 2
... IRGPC40UD2 Electrical Characteristics @ T Parameter V Collector-to-Emitter Breakdown Voltage (BR)CES Temp. Coeff. of Breakdown Voltage (BR)CES J V Collector-to-Emitter Saturation Voltage CE(on) V Gate Threshold Voltage GE(th Temp. Coeff. of Threshold Voltage GE(th Forward Transconductance fe I Zero Gate Voltage Collector Current CES V Diode Forward Voltage Drop FM I Gate-to-Emitter Leakage Current ...
Page 3
... Fig Typical Load Current vs. Frequency 1000 °C J 100 ° 0µ IDTH ollector-to-E m itter V oltage ( Fig Typical Output Characteristics 1 f, Frequency (kHz) (Load Current = I of fundamental) RMS 1000 100 0° 0 Fig Typical Transfer Characteristics C-719 IRGPC40UD2 ° ° ifie tio 5° 5µ ate - itter V olta 100 20 ...
Page 4
... IRGPC40UD2 100 T , Case Temperature (°C) C Fig Maximum Collector Current vs. Case Temperature 0.2 0 0.1 0 .05 SIN ( 0.0 2 0.0 1 0.01 0.00001 0.0001 Fig Maximum IGBT Effective Transient Thermal Impedance, Junction-to-Case 3 15V µ 3.0 2.5 2.0 A 1.5 125 150 -60 -40 Fig Collector-to-Emitter Voltage vs. ...
Page 5
... R , Gate Resistance ( ) G Fig Typical Switching Losses vs. Gate Resistance SHORTED Fig Typical Gate Charge vs 0 -60 -40 W Fig Typical Switching Losses vs. C-721 IRGPC40UD2 = tal Gate-to-Emitter Voltage I = 40A 20A 10A 15V = 480V - 100 120 140 160 T , Case Temperature (°C) C Case Temperature 60 A ...
Page 6
... IRGPC40UD2 8 150° 480V 15V GE 6.0 4.0 2.0 0 Collector-to-Emitter Current (A) C Fig Typical Switching Losses vs. Collector-to-Emitter Current Fig Maximum Forward Voltage Drop vs. Instantaneous Forward Current 1000 100 100 150° 125° 25° 0.8 1.2 1.6 2.0 Forward Voltage Drop - V FM ...
Page 7
... Fig Typical Reverse Recovery vs. di 800 V = 200V 125° 25°C J 600 I = 30A F 400 I = 15A 5.0A F 200 0 100 di /dt - (A/µs) f Fig Typical Stored Charge vs. di IRGPC40UD2 100 V = 200V 125° 25° 15A 1000 100 Fig Typical Recovery Current vs. di /dt f 1000 V = 200V 125° 25° ...
Page 8
... IRGPC40UD2 430µF 80% of Vce Fig. 18a - Test Circuit for Measurement off(diode d(on) GATE VOLTAGE D.U.T. 10% +Vg +Vg Vce 10% Ic Vcc 90 Vce td(on Fig. 18c - Test Waveforms for Circuit of Fig. 18a, Defining d(on) Refer to Section D for the following: Appendix D: Section D - page D-6 Fig ...
Page 9
Note: For the most current drawings please refer to the IR website at: http://www.irf.com/package/ ...