HDSP-4840 Avago Technologies US Inc., HDSP-4840 Datasheet - Page 7
HDSP-4840
Manufacturer Part Number
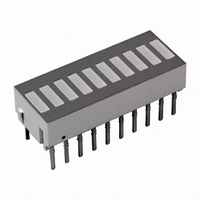
HDSP-4840
Description
LED BAR GRAPH 10SEG YELLOW
Manufacturer
Avago Technologies US Inc.
Datasheet
1.HDSP-4830.pdf
(7 pages)
Specifications of HDSP-4840
Color
Yellow (x 20)
Voltage Rating
2.2V
Current
20mA
Lens Style/size
Rectangle, 5.08mm x 1.52mm
Configuration
10 Segment
Mounting Type
Through Hole
Number Of Digits
10
Illumination Color
Yellow
Wavelength
583 nm
Operating Voltage
2.2 V
Operating Current
60 mA
Maximum Operating Temperature
+ 85 C
Minimum Operating Temperature
- 40 C
Luminous Intensity
1900 mcd
Display Type
Bar Graph
Led Configuration
Bar
Led Color
10 Yellow
Forward Voltage
2.2V
Forward Current If
20mA
Leaded Process Compatible
Yes
Rohs Compliant
Yes
Display Size
25.4mm X 10.16mm
Lead Free Status / RoHS Status
Lead free / RoHS Compliant
Lens Type
-
Lead Free Status / Rohs Status
Lead free / RoHS Compliant
Other names
516-1240-5


Electrical/Optical
These versatile bar graph arrays are composed of ten
light emitting diodes. The light from each LED is optically
stretched to form individual elements. The Red (HDSP-
4820) bar graph array LEDs use a p-n junction diffused
into a GaAsP epitaxial layer on a GaAs substrate. The Al-
GaAs Red (HLCP-J100) bar graph array LEDs use double
heterojunction AlGaAs on a GaAs substrate. HER (HDSP-
4830) and Yellow (HDSP-4840) bar graph array LEDs use
a GaAsP epitaxial layer on a GaP substrate. Green (HDSP-
4850) bar graph array LEDs use liquid phase GaP epi-
taxial layer on a GaP substrate. The multicolor bar graph
arrays (HDSP-4832/4836) have HER, Yellow, and Green
LEDs in one package. These displays are designed for
strobed operation. The typical forward voltage values
can be scaled from Figures 5 and 11. These values should
be used to calculate the current limiting resistor value
and typical power consumption. Expected maximum V
values for driver circuit design and maximum power dis-
sipation may be calculated using the V
Standard Red HDSP-4820 series
V
For: I
AlGaAs Red HLCP-J100 series
V
For: I
V
For: I
HER (HDSP-4830) and Yellow
(HDSP-4840) series
V
For: 5 mA d I
V
For: I
Green (HDSP-4850) series
V
For: I
For product information and a complete list of distributors, please go to our web site:
Avago, Avago Technologies, and the A logo are trademarks of Avago Technologies in the United States and other countries.
Data subject to change. Copyright © 2005-2009 Avago Technologies. All rights reserved. Obsoletes AV01-0277EN
AV02-1798EN - November 5, 2009
F
F
F
F
F
F
MAX = 1.8 V + I
MAX = 1.8 V + I
MAX = 2.0 V + I
MAX = 1.6 + I
MAX = 1.75 + I
MAX = 2.0 + I
Peak
Peak
Peak
Peak
Peak
t 5 mA
d 20 mA
t 20 mA
t 20 mA
> 5 mA
Peak
Peak
Peak
d 20 mA
Peak
Peak
Peak
Peak
(45 :)
(50 :)
(38 :)
(10 :)
(20 :)
(10 :)
FMAX
models:
F
www.avagotech.com
Figures 4 and 10 allow the designer to calculate the lu-
minous intensity at different peak and average currents.
The following equation calculates intensity at different
peak and average currents:
I
SHEET)K
Where:
I
sity resulting from I
I
I
I
K
scaled from Figure 4 or 10.
I
resulting from I
For example, what is the luminous intensity of an HDSP-
4830 driven at 50 mA peak 1/5 duty factor?
I
I
K
I
Therefore
I
V
V
F
F
V
V
F
F
V
V
AVG is the desired time averaged LED current.
AVG DATA SHEET is the data sheet test current for
peak
AVG = (50 mA) (0.2) = 10 mA
AVG DATA SHEET = 10 mA
peak
AVG = (I
AVG is the calculated time averaged luminous inten-
AVG = (10 mA/10 mA) (1.3) (3500 mcd) = 4550 mcd
DATA SHEET.
DATA SHEET is the data sheet luminous intensity,
DATA SHEET = 3500 Pcd
is the relative efficiency at the peak current,
= 1.3
peak
F
AVG/I
)(I
V
F
DATA SHEET)
F
AVG DATA SHEET.
AVG DATA
F
AVG.
Related parts for HDSP-4840
Image
Part Number
Description
Manufacturer
Datasheet
Request
R

Part Number:
Description:
Seven-Segment Numeric LED Display,4-CHARACTER,Green,DIP
Manufacturer:
Avago Technologies US Inc.
Datasheet:
Part Number:
Description:
Seven-Segment Numeric LED Display,4-CHARACTER,Green,DIP
Manufacturer:
Avago Technologies US Inc.
Datasheet:
Part Number:
Description:
Seven-Segment Numeric LED Display,4-CHARACTER,Green,DIP
Manufacturer:
Avago Technologies US Inc.
Datasheet:
Part Number:
Description:
Seven-Segment Numeric LED Display,4-CHARACTER,Green,DIP
Manufacturer:
Avago Technologies US Inc.
Datasheet:
Part Number:
Description:
Seven-Segment Numeric LED Display,4-CHARACTER,Green,DIP
Manufacturer:
Avago Technologies US Inc.
Datasheet:

Part Number:
Description:
LED 7-SEG 14.2MM 2DIG CC HER RHD
Manufacturer:
Avago Technologies US Inc.
Datasheet:

Part Number:
Description:
LED 7-SEG 14.2MM 2DIG CA HER RHD
Manufacturer:
Avago Technologies US Inc.
Datasheet:

Part Number:
Description:
DISPLAY 7SEG 4DIG GREEN CA 0.56"
Manufacturer:
Avago Technologies US Inc.
Datasheet:
Part Number:
Description:
DISPLAY 7SEG 4DIG GREEN CC 0.56"
Manufacturer:
Avago Technologies US Inc.
Datasheet:
Part Number:
Description:
DISPLAY 7SEG 4DIG HER CC 0.56"
Manufacturer:
Avago Technologies US Inc.
Datasheet:
Part Number:
Description:
DISPLAY 7SEG 4DIG GREEN CC 0.56"
Manufacturer:
Avago Technologies US Inc.
Datasheet:
Part Number:
Description:
DISPLAY 7SEG 4DIG HER CA 0.56"
Manufacturer:
Avago Technologies US Inc.
Datasheet:
Part Number:
Description:
DISPLAY 7SEG 4DIG GREEN CA 0.56"
Manufacturer:
Avago Technologies US Inc.
Datasheet:

Part Number:
Description:
DISPLAY 7SEG 4DIG HER CA 0.56"
Manufacturer:
Avago Technologies US Inc.
Datasheet:
Part Number:
Description:
DISPLAY 7SEG 4DIG GREEN CC 0.56"
Manufacturer:
Avago Technologies US Inc.
Datasheet: