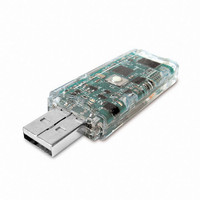
VR001 Mide Technology Corporation, VR001 Datasheet - Page 9

VR001
Manufacturer Part Number
VR001
Description
VIBRATION DATA LOGGER
Manufacturer
Mide Technology Corporation
Series
Slam Stick™, Volture™r
Specifications of VR001
Featured Product
Slam Stick⢠Vibration Recorder
Accessory Type
Vibration Characterization Device
Lead Free Status / Rohs Status
Lead free by exemption / RoHS compliant by exemption
For Use With/related Products
Volture™ Vibration Energy Harvesters
For Use With
V25W - PIEZOELECTRIC ENERGY HARVESTERV20W - PIEZOELECTRIC ENERGY HARVESTERV21BL - PIEZOELECTRIC ENERGY HARVESTERV21B - PIEZOELECTRIC ENERGY HARVESTERV22BL - PIEZOELECTRIC ENERGY HARVESTERV22B - PIEZOELECTRIC ENERGY HARVESTER
OPERATION
2-D Frequency options
The 2-D Fourier graph splits frequency data into small
time ‘slices’ to visualize time-dependent trends in the
frequency data. By default, the full frequency range is
shown on the 2-D Fourier graphs, and the data are
segmented into 4 slices per second (this can be
adjusted by editing the script). Since the FFT
implementation requires each slice to be of equal
length, the data will be reshaped into equal-length
slices, and (if necessary) up to one slice of trailing data
will be discarded to maintain equal slice lengths.
Unlike a 2-d plot, Matlab’s 3d surface plot cannot
easily be zoomed or panned to show only a specific
region of interest. To more easily view a specific data
feature, optional parameters can be input to constrain
the contents of the 2-D Fourier graphs. The parameters
accepted are:
Command Window
ss_view('filename', startfreq,
endfreq, ceiling);
C:\stuff\> pvr2csv J:\data.dat
Figure 7: Z Frequency 2D
File Edit View
Insert
REVISION N0. 001
Tools Desktop Window
REVISION DATE: 08-24-2010
The startfreq and endfreq parameters will constrain the
frequency range displayed, and the ceiling parameter
will constrain the maximum height (ceiling) of the plot
by cutting the tops off peaks above that value. For
example:
will show only the frequency range between 100 and
500 Hz.
will show the frequency range between 100 and 500
Hz, and also ceiling the amplitude to 0.5g so that small
features can be seen.
To provide a ceiling value without entering frequency
constraints, you can pass an empty string (two single
Command Window
Command Window
ss_view('vib0000.dat', 100, 500);
ss_view('vib0000.dat', 100, 500, 0.5);
Help
C:\stuff\> pvr2csv J:\data.dat
C:\stuff\> pvr2csv J:\data.dat
www.mide.com
9


