28029 Parallax Inc, 28029 Datasheet - Page 248
28029
Manufacturer Part Number
28029
Description
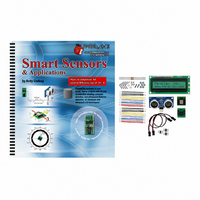
KIT PARTS SMART SENSORS W/TEXT
Manufacturer
Parallax Inc
Datasheet
1.122-28029.pdf
(340 pages)
Specifications of 28029
Accessory Type
Parts Kit
Product
Microcontroller Accessories
Lead Free Status / RoHS Status
Contains lead / RoHS non-compliant
For Use With/related Products
BASIC Stamp® or Javelin Modules
Lead Free Status / RoHS Status
Lead free / RoHS Compliant, Contains lead / RoHS non-compliant
Other names
28029PAR


Page 236 · Smart Sensors and Applications
The next step, which is also documented for Microsoft Excel 2002, is to run the chart
utility and tell it what to graph and how you want it to look.
Graphing the Car's Position and Velocity
If you know the initial position and velocity of an object, you can use the acceleration
during a period of time to calculate its position. These calculations can be made
iteratively in a spreadsheet to plot the velocity and the path of the RC car.
For example, the acceleration plot in Figure 6-10 shows a plot of the RC car as it
accelerates forward and backward. (The spreadsheet was modified so that positive values
indicate forward acceleration and negative values indicate backward acceleration or
deceleration.) So, this graph shows that the car accelerated forward at an average of
around 0.16 g for a little under 2 seconds. Then, it decelerated at an average of around
√
√
√
√
√
√
√
Your spreadsheet should be three columns wide and about 503 rows long.
Place the cursor in a cell somewhere to the right of your three columns of data.
Click Insert and select Chart.
In the Standard Types tab, select XY (Scatter). Also click the graphic that
configures it to "Scatter with data points connected to smoothed Lines without
markers". Then, click Next.
Assuming your y-axis data begins in C3 and ends in C503, type C3..C503 in the
Data range. Click the radio button next to Columns to indicate that the series of
data points is in a column. Then, click Next.
Fill in the chart title and axis information, then click Finish.
Repeat for the x-axis.
Only portions of each graph are relevant. Keep in mind that the data that will make
sense for the y-axis is the portion of time the car accelerated forward and backward.
Likewise, the part of the graph that will make sense for the x-axis is the portion when the car
was turning.
Downloading the Spreadsheet. The MS Excel spreadsheets used to plot these graphs are
available
www.parallax.com. Download the spreadsheet and examine the equations in the various
columns along with the settings for each plot.
for
download
from
the
Smart
Sensors
and
Applications
pages
at
Related parts for 28029
Image
Part Number
Description
Manufacturer
Datasheet
Request
R


Part Number:
Description:
Microcontroller Modules & Accessories DISCONTINUED BY PARALLAX
Manufacturer:
Parallax Inc

Part Number:
Description:
BOOK UNDERSTANDING SIGNALS
Manufacturer:
Parallax Inc
Datasheet:


Part Number:
Description:
COMPETITION RING FOR SUMOBOT
Manufacturer:
Parallax Inc
Datasheet:


Part Number:
Description:
TEXT INFRARED REMOTE FOR BOE-BOT
Manufacturer:
Parallax Inc
Datasheet:
Part Number:
Description:
BOARD EXPERIMENT+LCD NX-1000
Manufacturer:
Parallax Inc
Datasheet:

Part Number:
Description:
CONTROLLER 16SERVO MOTOR CONTROL
Manufacturer:
Parallax Inc
Datasheet:

Part Number:
Description:
BASIC STAMP LOGIC ANALYZER
Manufacturer:
Parallax Inc
Datasheet:

Part Number:
Description:
IC MCU 2K FLASH 50MHZ SO-18
Manufacturer:
Parallax Inc
Datasheet: