28029 Parallax Inc, 28029 Datasheet - Page 250
28029
Manufacturer Part Number
28029
Description
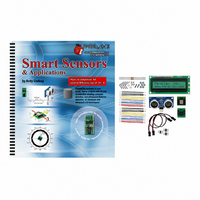
KIT PARTS SMART SENSORS W/TEXT
Manufacturer
Parallax Inc
Datasheet
1.122-28029.pdf
(340 pages)
Specifications of 28029
Accessory Type
Parts Kit
Product
Microcontroller Accessories
Lead Free Status / RoHS Status
Contains lead / RoHS non-compliant
For Use With/related Products
BASIC Stamp® or Javelin Modules
Lead Free Status / RoHS Status
Lead free / RoHS Compliant, Contains lead / RoHS non-compliant
Other names
28029PAR


Page 238 · Smart Sensors and Applications
Figure 6-11: Velocity Graph Derived from Initial Position and Acceleration Data
The calculations for this plot are made in the spreadsheet's column-F. If you click cell F-
17 in the spreadsheet, this equation should appear in the function field:
In this case, F16 is the cell just above F17, and it has the previous velocity. This previous
velocity is used as V
9.8 * E17 / 100 takes the E17 measurement, which is in hundredths of a g and converts
it to meters per second (m/s
down to g and then multiplying by 9.8 converts from g to m/s
approximately 9.8 m/s
With columns in the spreadsheet for acceleration and velocity, it is now possible to also
keep track of the car's position using the equation s = s
position of the car (s) is equal to the initial position (s
and time (v
resulting graph of position shown in Figure 6-12 is surprisingly accurate. The car did in
fact go forward to about the 3.5 meter mark before stopping. Then, it backed up and
came to rest almost a meter behind where it started.
=F16 + (0.03*9.8*E17/100)
0
t), plus half the product of acceleration and the square of time (
0
2
for the sample interval. 0.03 is t, the time between samples, and
.
2
). Dividing by 100 takes the value from hundredths of a g
0
) plus the product of initial velocity
0
+ v
0
2
t +
. That's because 1 g is
1
/
2
at
2
. That is, the
1
/
2
at
2
). The
Related parts for 28029
Image
Part Number
Description
Manufacturer
Datasheet
Request
R


Part Number:
Description:
Microcontroller Modules & Accessories DISCONTINUED BY PARALLAX
Manufacturer:
Parallax Inc

Part Number:
Description:
BOOK UNDERSTANDING SIGNALS
Manufacturer:
Parallax Inc
Datasheet:


Part Number:
Description:
COMPETITION RING FOR SUMOBOT
Manufacturer:
Parallax Inc
Datasheet:


Part Number:
Description:
TEXT INFRARED REMOTE FOR BOE-BOT
Manufacturer:
Parallax Inc
Datasheet:
Part Number:
Description:
BOARD EXPERIMENT+LCD NX-1000
Manufacturer:
Parallax Inc
Datasheet:

Part Number:
Description:
CONTROLLER 16SERVO MOTOR CONTROL
Manufacturer:
Parallax Inc
Datasheet:

Part Number:
Description:
BASIC STAMP LOGIC ANALYZER
Manufacturer:
Parallax Inc
Datasheet:

Part Number:
Description:
IC MCU 2K FLASH 50MHZ SO-18
Manufacturer:
Parallax Inc
Datasheet: