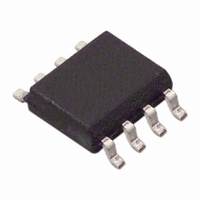
AD7895BR-2 Analog Devices Inc, AD7895BR-2 Datasheet - Page 11

AD7895BR-2
Manufacturer Part Number
AD7895BR-2
Description
IC ADC 12BIT SRL 5V 8-SOIC
Manufacturer
Analog Devices Inc
Datasheet
1.AD7895ARZ-10REEL.pdf
(12 pages)
Specifications of AD7895BR-2
Rohs Status
RoHS non-compliant
Number Of Bits
12
Sampling Rate (per Second)
192k
Data Interface
Serial
Number Of Converters
1
Power Dissipation (max)
20mW
Voltage Supply Source
Single Supply
Operating Temperature
-40°C ~ 85°C
Mounting Type
Surface Mount
Package / Case
8-SOIC (0.154", 3.90mm Width)
Dynamic Performance (Mode 1 Only)
With a combined conversion and acquisition time of 4.1 s, the
AD7895 is ideal for wide bandwidth signal processing applica-
tions. These applications require information on the ADC’s
effect on the spectral content of the input signal. Signal to
(Noise + Distortion), Total Harmonic Distortion, Peak Har-
monic or Spurious Noise, and Intermodulation Distortion are
all specified. Figure 11 shows a typical FFT plot of a 10 kHz,
0 V to +5 V input after being digitized by the AD7895 operating
at a 198.656 kHz sampling rate. The Signal to (Noise + Distor-
tion) Ratio is 73.04 dB, and the Total Harmonic Distortion is
–84.91 dB.
The formula for Signal to (Noise + Distortion) Ratio (see
Terminology section) is related to the resolution or number of
bits in the converter. Rewriting the formula, below, gives a
measure of performance expressed in effective number of bits (N):
where SNR is Signal to (Noise + Distortion) Ratio.
The effective number of bits for a device can be calculated from
its measured Signal to (Noise + Distortion) Ratio. Figure 12
shows a typical plot of effective number of bits versus frequency
for the AD7895 from dc to f
is 198.656 kHz. The plot shows that the AD7895 converts an
input sine wave of 10 kHz to an effective numbers of bits of
11.84, which equates to a Signal to (Noise + Distortion) level of
73.04 dB.
REV. 0
Figure 11. AD7896 FFT Plot Effective Number of Bits
–100
–110
–120
–10
–20
–30
–40
–50
–60
–70
–80
–90
–0
0
10k
N = (SNR 1.76)/6.02
30k
SAMPLING
50k
/2. The sampling frequency
F
F
SNR = –73.04dB
THD = –84.91dB
70k
SAMPLE
IN
= 10kHz
= 198656
90k
9.9k
–11–
Power Considerations
In the automatic power-down mode, then, the part may be
operated at a sample rate that is considerably less than
100 kHz. In this case, the power consumption will be reduced
and will depend on the sample rate. Figure 13 shows a graph
of the power consumption versus sampling rates from 100 Hz to
90 kHz in the automatic power-down mode. The conditions
are 5 V supply 25 C, serial clock frequency of 8.33 MHz, and
the data was read after conversion.
Figure 13. Power vs. Sample Rate in Auto Power-Down
Mode
Figure 12. Effective Number of Bits vs. Frequency
12.0
11.8
11.6
11.4
11.2
11.0
10.8
10.6
10.4
10.2
10.0
11
10
0.1
0
9
8
7
6
5
4
3
2
1
0
10
200
20
30
FREQUENCY – kHz
400
FREQUENCY – kHz
40
50
600
60
800
70
AD7895
80
1000
90


