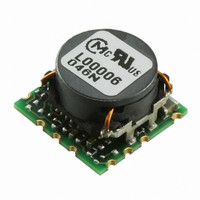
OKL-T/6-W5N-C Murata Power Solutions Inc, OKL-T/6-W5N-C Datasheet - Page 15

OKL-T/6-W5N-C
Manufacturer Part Number
OKL-T/6-W5N-C
Description
CONV DC/DC 19.8W 6A 5VIN SMD
Manufacturer
Murata Power Solutions Inc
Series
Okami™ OKL-T/6-W5r
Type
Point of Load (POL) Non-Isolatedr
Specifications of OKL-T/6-W5N-C
Number Of Outputs
1
Output
0.6 ~ 3.3V
Power (watts)
19.8W
Mounting Type
Surface Mount
Voltage - Input
2.4 ~ 5.5 V
Package / Case
12-SMD Module
1st Output
0.6 ~ 3.3 VDC @ 6A
Size / Dimension
0.48" L x 0.48" W x 0.28" H (12.2mm x 12.2mm x 7.1mm)
Power (watts) - Rated
19.8W
Operating Temperature
-40°C ~ 85°C
Efficiency
93.5%
Approvals
CSA, cUL, EN, IEC, UL
Output Power
19.8 W
Input Voltage Range
2.4 V to 5.5 V
Input Voltage (nominal)
5 V
Package / Case Size
12.2 mm x 12.2 mm x7.2 mm
Output Voltage
0.6 V to 3.3 V
Product
Non-Isolated / POL
Lead Free Status / RoHS Status
Lead free / RoHS Compliant
3rd Output
-
2nd Output
-
Lead Free Status / Rohs Status
Lead free / RoHS Compliant
Other names
811-2213-2
immediately adjacent to the converter’s input terminals. The capacitor
should be a ceramic type such as the Murata GRM32 series or a polymer
type. Initial suggested capacitor values are 10 to 22 μF, rated at twice the
expected maximum input voltage. Make sure that the input terminals do
not go below the undervoltage shutdown voltage at all times. More input
bulk capacitance may be added in parallel (either electrolytic or tantalum)
if needed.
Recommended Output Filtering
The converter will achieve its rated output ripple and noise with no
additional external capacitor. However, the user may install more exter-
nal output capacitance to reduce the ripple even further or for improved
dynamic response. Again, use low-ESR ceramic (Murata GRM32 series)
or polymer capacitors. Initial values of 10 to 47 μF may be tried, either
single or multiple capacitors in parallel. Mount these close to the converter.
Measure the output ripple under your load conditions.
noise objectives. Excessive capacitance can make step load recovery
sluggish or possibly introduce instability. Do not exceed the maximum rated
output capacitance listed in the specifi cations.
Input Ripple Current and Output Noise
All models in this converter series are tested and specifi ed for input
refl ected ripple current and output noise using designated external input/
output components, circuits and layout as shown in the fi gures below. The
Cbus and Lbus components simulate a typical DC voltage bus. Please note
that the values of Cin, Lbus and Cbus will vary according to the specifi c
converter model.
impedances between the power supply and its load. In order to minimize
circuit errors and standardize tests between units, scope measurements
should be made using BNC connectors or the probe ground should not
exceed one half inch and soldered directly to the test circuit.
V
For best performance, we recommend installing a low-ESR capacitor
Use only as much capacitance as required to achieve your ripple and
IN
In fi gure 5, the two copper strips simulate real-world printed circuit
OSCILLOSCOPE
C
C
L
+
+
BUS
–
–
IN
BUS
TO
= 2 x 100μF, ESR < 700mΩ @ 100kHz
= 1μH
= 1000μF, ESR < 100mΩ @ 100kHz
C
Figure 4: Measuring Input Ripple Current
BUS
L
BUS
CURRENT
PROBE
C
IN
+INPUT
-INPUT
www.murata-ps.com
Minimum Output Loading Requirements
All models regulate within specifi cation and are stable under no load to full
load conditions. Operation under no load might however slightly increase
output ripple and noise.
Thermal Shutdown
To prevent many over temperature problems and damage, these converters
include thermal shutdown circuitry. If environmental conditions cause the
temperature of the DC/DC’s to rise above the Operating Temperature Range
up to the shutdown temperature, an on-board electronic temperature
sensor will power down the unit. When the temperature decreases below
the turn-on threshold, the converter will automatically restart. There is a
small amount of hysteresis to prevent rapid on/off cycling.
may shut down suddenly without warning. Be sure to thoroughly test your
application to avoid unplanned thermal shutdown.
Temperature Derating Curves
The graphs in the next section illustrate typical operation under a variety of
conditions. The Derating curves show the maximum continuous ambient air
temperature and decreasing maximum output current which is accept-
able under increasing forced airfl ow measured in Linear Feet per Minute
(“LFM”). Note that these are AVERAGE measurements. The converter will
accept brief increases in current or reduced airfl ow as long as the average
is not exceeded.
itself which is obviously running at higher temperature than the outside
air. Also note that very low fl ow rates (below about 25 LFM) are similar to
“natural convection”, that is, not using fan-forced airfl ow.
closed cycle wind tunnel with calibrated airflow. We use both thermo-
couples and an infrared camera system to observe thermal performance.
altitude. Be sure to reduce the derating for higher density altitude.
CAUTION: If you operate too close to the thermal limits, the converter
Note that the temperatures are of the ambient airfl ow, not the converter
Murata Power Solutions makes Characterization measurements in a
CAUTION: These graphs are all collected at slightly above Sea Level
Programmable Output 6-Amp iLGA SMT PoLs
+OUTPUT
-OUTPUT
Figure 5: Measuring Output Ripple and Noise (PARD)
28 Mar 2011 MDC_OKL-T/6-W5 Series.A07 Page 15 of 17
C1 = 1μF CERAMIC
C2 = 10μF CERAMIC
LOAD 2-3 INCHES (51-76mm) FROM MODULE
OKL-T/6-W5 Series
C1
COPPER STRIP
COPPER STRIP
email: sales@murata-ps.com
C2
SCOPE
R
LOAD


