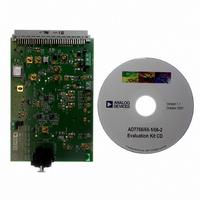
EVAL-AD7766-1EDZ Analog Devices Inc, EVAL-AD7766-1EDZ Datasheet - Page 10

EVAL-AD7766-1EDZ
Manufacturer Part Number
EVAL-AD7766-1EDZ
Description
BOARD EVAL AD7766-1 64KSPS 111DB
Manufacturer
Analog Devices Inc
Specifications of EVAL-AD7766-1EDZ
Number Of Adc's
1
Number Of Bits
24
Sampling Rate (per Second)
64k
Data Interface
Serial
Inputs Per Adc
1 Differential
Input Range
±VREF
Power (typ) @ Conditions
10.5mW @ 64kSPS
Voltage Supply Source
Analog and Digital
Operating Temperature
-40°C ~ 105°C
Utilized Ic / Part
AD7766-1
Lead Free Status / RoHS Status
Lead free / RoHS Compliant
EVAL-AD7766/66-1/66-2
Data Capture Tab
In the Data Capture tab, the user can select the number of
samples to be captured from the drop down menu. The default
number of samples is 4096; the user is free to change this as
required. When looking at the AD7766/-1/-2 device it’s often
beneficial to look at the statistics for a certain analog input over
larger sample sets, such as 65536 samples.
To initiate a conversion and capture the sample data you must
click on the Sample button or the Continuous button. Both the
Sample and the Continuous sample buttons are located on the
top right hand corner of the Data Capture Tab. When you click
the Sample button, the software instructs the EVAL-CED1Z
board to take the required number of samples at the required
frequency from the evaluation board.
The samples taken are then uploaded and displayed. An FFT
and/or histogram can be calculated and displayed. If you click
the Continuous button, the software repeats the process
indefinitely until you click Stop. (The Continuous button
switches to Stop when clicked). The desired display option is
selected by clicking on the Waveform, Histogram, FFT and
Summary tab buttons. Please note that there is a certain delay
(associated with data transfer on the USB link) which means
that the data shown in Continuous mode is not sequential data.
The mode is designed so that the user can see multiple sets of
samples without having to constantly click the Sample button.
Rev. PrB | Page 10 of 24
The Data Capture Tab has the following sub-tabs:
Waveform Tab
The Waveform sub-tab displays a digital storage oscilloscope
(DSO) that allows you to display a waveform. When samples are
uploaded from the EVAL-CED1Z board, they are displayed
here. The samples are displayed as integer code values.
At the bottom left of the graph are the zoom options. These
allow you to zoom in and out to get a closer look at a sample, if
required. The Waveform Analysis section, which is located
beneath the waveform graph, contains information about the
samples taken, for example, minimum/ maximum position or
frequency, the spread, the standard deviation, and the mean.
Histogram Tab
This tab displays a Histogram of the captured ADC codes. It
can be used to give an indication of the ADC’s performance in
response to dc inputs. The Histogram Analysis section
contains information about the samples taken, for example,
maximum and minimum codes captured, spread, mean and
standard deviation.
FFT Tab
This tab displays a Fast Fourier Transform (FFT) Plot. The FFT
is typically used for examining the ADC’s performance in the
frequency domain. The Spectrum Analysis section contains
information about the samples taken; SNR, THD, Peak
Spurious Noise, Individual Harmonic levels etc...
Summary Tab
This tab displays a summary of the graphs shown in the
Waveform Tab, Histogram Tab and FFT Tab.
Preliminary Technical Data


