DEMO9S08JS16 Freescale Semiconductor, DEMO9S08JS16 Datasheet - Page 24
DEMO9S08JS16
Manufacturer Part Number
DEMO9S08JS16
Description
BOARD DEMO FOR JS16 FAMILY
Manufacturer
Freescale Semiconductor
Type
MCUr
Datasheets
1.DC9S08JS16.pdf
(49 pages)
2.DEMO9S08JS16.pdf
(32 pages)
3.DEMO9S08JS16.pdf
(8 pages)
4.DEMO9S08JS16.pdf
(8 pages)
5.DEMO9S08JS16.pdf
(4 pages)
Specifications of DEMO9S08JS16
Contents
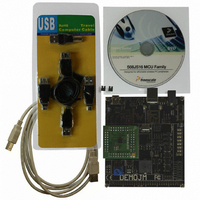
2 Boards, Cable, Documentation, DVD
Processor To Be Evaluated
MC9S08JS16
Data Bus Width
8 bit
Interface Type
USB
Operating Supply Voltage
5 V
Silicon Manufacturer
Freescale
Core Architecture
HCS08
Core Sub-architecture
HCS08
Silicon Core Number
MC9S08
Silicon Family Name
S08JS
Rohs Compliant
Yes
For Use With/related Products
MC9S08JS16
Lead Free Status / RoHS Status
Lead free / RoHS Compliant


Figure 6-4: Accelerometer Demo Application
The data that is graphed may come from either the PC serial port or the virtual
serial port on the DEMOJM board. The serial port of the microcontroller on the
DEMOJM board is routed to the virtual COM port with the setting of jumper
J4. To properly configure accelerometer and potentiometer resources on the
DEMOJM evaluation board, please make sure that these headers are
populated with jumpers in the following manner: J21 (Z/PTB1 -populated, Y/
PTB0 –populated, Y/PTB3 -populated, X/PTD0 –unpopulated); J18 (set to 0);
J19 (set to 0); J20 (set to 1); J32 (PTB2 –populated, PTD1 –populated).
To start using this application, please choose COM or virtual USB COM
settings from the drop-down Port menu. By doing so, you are specifying the
port on the evaluation board that will be used for transmitting captured
accelerometer data via a COM or USB serial port. Please make sure that
jumper J4 is set accordingly. Prior to starting serial data capture, please
specify the Baud setting to reflect the parameter at which your serial
communication interface is operating. Once your port settings are configured,
please plug a USB or DB9 serial cable into the evaluation board and click on
the Open Serial Port and Start Demo buttons. After the serial data is captured
by the application you will see raw data in the Terminal Window. In the
meantime, the Data Snapshot window will display the accelerometer and
potentiometer data levels in the form of a bar graph. The graphing of data can
be paused and the scale of the X and Y axes can be changed via a tool bar
located in the top right corner of the Accelerometer Demo Application.
20
DEMO9S08JS16 User Manual
Related parts for DEMO9S08JS16
Image
Part Number
Description
Manufacturer
Datasheet
Request
R

Part Number:
Description:
Manufacturer:
Freescale Semiconductor, Inc
Datasheet:
Part Number:
Description:
Manufacturer:
Freescale Semiconductor, Inc
Datasheet:
Part Number:
Description:
Manufacturer:
Freescale Semiconductor, Inc
Datasheet:
Part Number:
Description:
Manufacturer:
Freescale Semiconductor, Inc
Datasheet:
Part Number:
Description:
Manufacturer:
Freescale Semiconductor, Inc
Datasheet:
Part Number:
Description:
Manufacturer:
Freescale Semiconductor, Inc
Datasheet:
Part Number:
Description:
Manufacturer:
Freescale Semiconductor, Inc
Datasheet:
Part Number:
Description:
Manufacturer:
Freescale Semiconductor, Inc
Datasheet:
Part Number:
Description:
Manufacturer:
Freescale Semiconductor, Inc
Datasheet:
Part Number:
Description:
Manufacturer:
Freescale Semiconductor, Inc
Datasheet:
Part Number:
Description:
Manufacturer:
Freescale Semiconductor, Inc
Datasheet:
Part Number:
Description:
Manufacturer:
Freescale Semiconductor, Inc
Datasheet:
Part Number:
Description:
Manufacturer:
Freescale Semiconductor, Inc
Datasheet:
Part Number:
Description:
Manufacturer:
Freescale Semiconductor, Inc
Datasheet:
Part Number:
Description:
Manufacturer:
Freescale Semiconductor, Inc
Datasheet: