ULINKPRO Keil, ULINKPRO Datasheet - Page 104
ULINKPRO
Manufacturer Part Number
ULINKPRO
Description
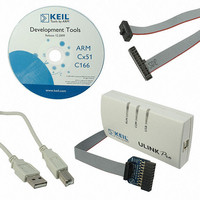
KIT DEBUG/TRACE UNIT HIGH SPEED
Manufacturer
Keil
Type
In-Circuit, Real-Time Debugger/Programmerr
Specifications of ULINKPRO
Contents
Module
For Use With/related Products
ARM7, ARM9, Cortex
Lead Free Status / RoHS Status
Lead free / RoHS Compliant


Getting Started: Creating Applications with µVision
103
Execution Profiler
The Execution Profiler in µVision records the amount of time and the number
of times each assembler instruction and high-level statement in your program
executes.
The amount of time and the number of calls, which are displayed in the
Disassembly Window and in the Editor Window alike, are cumulative values.
Enable the Execution Profiler through the Debug – Execution Profiling Menu.
Invoke the Context Menu of the Disassembly Window to switch between the
time and calls.
When you locate program hotspots (with the Performance Analyzer), the
Execution Profiler makes it easy to find real performance bottlenecks.
Related parts for ULINKPRO
Image
Part Number
Description
Manufacturer
Datasheet
Request
R

Part Number:
Description:
MCU, MPU & DSP Development Tools USB-JTAG Adapter
Manufacturer:
Keil Tools

Part Number:
Description:
KEIL C-COMPILER INTERNATIONAL
Manufacturer:
Silicon Laboratories Inc
Part Number:
Description:
KEIL C-COMPILER US VERSION
Manufacturer:
Silicon Laboratories Inc

Part Number:
Description:
DEV KIT FOR STM32
Manufacturer:
STMicroelectronics
Datasheet:

Part Number:
Description:
KIT STARTER FOR STM32
Manufacturer:
STMicroelectronics
Datasheet:

Part Number:
Description:
KIT STARTER FOR STM32F10XE MCU
Manufacturer:
STMicroelectronics
Datasheet:

Part Number:
Description:
KIT STARTER KEIL FOR STR910
Manufacturer:
STMicroelectronics
Datasheet:


Part Number:
Description:
Microcontroller Modules & Accessories KEIL ULINK PRO 5V ADAPTOR KIT
Manufacturer:
Keil Software
Part Number:
Description:
Development Boards & Kits - ARM KEIL NUVOTON EVAL BD CORTEX-M0 + ULINK-ME
Manufacturer:
Keil Tools
Datasheet:
Part Number:
Description:
Development Boards & Kits - ARM KEIL NUVOTON EVAL BD CORTEX-M0
Manufacturer:
Keil Tools
Datasheet:

Part Number:
Description:
BOARD EVAL FOR LPC213X ARM MCU
Manufacturer:
NXP Semiconductors
Datasheet:

Part Number:
Description:
K60N512 Keil Tower Kit
Manufacturer:
Freescale Semiconductor
Datasheet: