ULINKPRO Keil, ULINKPRO Datasheet - Page 74
ULINKPRO
Manufacturer Part Number
ULINKPRO
Description
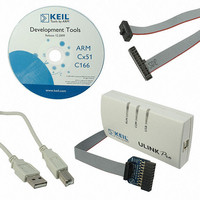
KIT DEBUG/TRACE UNIT HIGH SPEED
Manufacturer
Keil
Type
In-Circuit, Real-Time Debugger/Programmerr
Specifications of ULINKPRO
Contents
Module
For Use With/related Products
ARM7, ARM9, Cortex
Lead Free Status / RoHS Status
Lead free / RoHS Compliant


Getting Started: Creating Applications with µVision
Output Windows
By default, the Output Windows
screen and include:
1
‘window’ is interchangeably used in this book.
Since almost all objects can be moved to their own window frame, the terminology ‘page’ and
The Build Output Window includes errors and warnings from the compiler,
assembler, and linker. Double-click a message to jump to the location of the
source code that triggered the message. Press
The Command Window allows you to enter commands and review
debugger responses. Hints are provided on the Status Bar of that window.
Press
The Find in Files Window allows you to double-click a result to locate the
source code that triggered the message
The Serial and UART windows display I/O information of your peripherals
The Call Stack Window enables you to follow the program call tree
The Locals Window displays information about local variables of the
current function
The Watch windows provide a convenient way to personalize a set of
variables you would like to trace. Objects, structures, unions, and arrays may
be monitored in detail.
The Symbols Window is a handy option to locate object definitions. You
can drag and drop these items into other areas of µVision.
The Memory windows enable you to examine values in memory areas.
Define your preferred address to view data.
The Source Browser Window offers a fast way to find occurrences and
definitions of objects. Enter your search criteria to narrow the output.
F1
for on-line help.
1
are displayed at the bottom of the µVision
F1
for on-line help.
73
Related parts for ULINKPRO
Image
Part Number
Description
Manufacturer
Datasheet
Request
R

Part Number:
Description:
MCU, MPU & DSP Development Tools USB-JTAG Adapter
Manufacturer:
Keil Tools

Part Number:
Description:
KEIL C-COMPILER INTERNATIONAL
Manufacturer:
Silicon Laboratories Inc
Part Number:
Description:
KEIL C-COMPILER US VERSION
Manufacturer:
Silicon Laboratories Inc

Part Number:
Description:
DEV KIT FOR STM32
Manufacturer:
STMicroelectronics
Datasheet:

Part Number:
Description:
KIT STARTER FOR STM32
Manufacturer:
STMicroelectronics
Datasheet:

Part Number:
Description:
KIT STARTER FOR STM32F10XE MCU
Manufacturer:
STMicroelectronics
Datasheet:

Part Number:
Description:
KIT STARTER KEIL FOR STR910
Manufacturer:
STMicroelectronics
Datasheet:


Part Number:
Description:
Microcontroller Modules & Accessories KEIL ULINK PRO 5V ADAPTOR KIT
Manufacturer:
Keil Software
Part Number:
Description:
Development Boards & Kits - ARM KEIL NUVOTON EVAL BD CORTEX-M0 + ULINK-ME
Manufacturer:
Keil Tools
Datasheet:
Part Number:
Description:
Development Boards & Kits - ARM KEIL NUVOTON EVAL BD CORTEX-M0
Manufacturer:
Keil Tools
Datasheet:

Part Number:
Description:
BOARD EVAL FOR LPC213X ARM MCU
Manufacturer:
NXP Semiconductors
Datasheet:

Part Number:
Description:
K60N512 Keil Tower Kit
Manufacturer:
Freescale Semiconductor
Datasheet: