HDJD-JD06 Avago Technologies US Inc., HDJD-JD06 Datasheet - Page 10
HDJD-JD06
Manufacturer Part Number
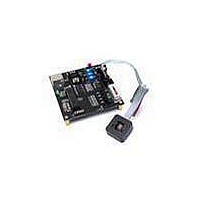
HDJD-JD06
Description
KIT DEV RGB COLOR SENSOR 16-QFN
Manufacturer
Avago Technologies US Inc.
Specifications of HDJD-JD06
Sensor Type
Light, Color Sensor
Sensing Range
RGB
Interface
Analog
Voltage - Supply
4.5 V ~ 5.5 V
Embedded
No
Utilized Ic / Part
ADJD-E622-QR999
For Use With/related Products
ADJD-E622-QR999
Lead Free Status / RoHS Status
Not applicable / Not applicable


XYZ -> Yxy
The tristimulus values X, Y and Z define a color in the CIE
XYZ space. The CIE XYZ is a 3D linear color space, and
the results are not easily visualized. Because of this, CIE
also defined a color space in 1931 for graphing color in
2D independent of lightness, the Yxy color space. The
Y is the lightness component of color while the xy are
the chromaticity coordinates calculated from the XYZ
tristimulus values. The concept of color can be divided
into two parts: brightness and chromaticity. For example,
the color white is a bright color, while the color grey is
considered to be a less bright version of that same white.
In other words, the chromaticity of white and grey are
the same while their brightness differs.
The x and y are calculated based on the following for-
mula:
Y is identical to tristimulus value Y.
XYZ -> L*a*b*
CIE L*a*b* (CIELAB) is the most complete color model
used conventionally to describe all the colors visible to
the human eye. The three parameters in the model rep-
resent the lightness of the color (L*, L*=0 yields black and
L*=100 indicates white), its position between magenta
and green (a*, negative values indicate green while posi-
tive values indicate magenta) and its position between
yellow and blue (b*, negative values indicate blue and
positive values indicate yellow).
CIE 1976 L*a*b* is based directly on the CIE 1931 XYZ
color space as an attempt to linearize the perceptibility
of color differences, using the color difference metric de-
scribed by the MacAdam ellipse. The non-linear relations
for L*, a*, and b* are intended to mimic the logarithmic
response of the eye.
10
CIE xy chart
The CIE xy chart can be access in the following 2 ways:
1. Click on CIE xy Chart button at features section at the
2. Click menu View -> CIE xy Chart.
To view the CIE xy chart real time, user had to activate
the color chart/ conversion. Then a circle will appear
showing the color measured by the color sensor at the
CIE xy chart.
main GUI.
Method 2
Circle (Color Space Indicator)
Method 1
CIE xy coordinate
Related parts for HDJD-JD06
Image
Part Number
Description
Manufacturer
Datasheet
Request
R

Part Number:
Description:
KIT DEV RGB COLOR SENSOR 16-QFN
Manufacturer:
Avago Technologies US Inc.
Datasheet:

Part Number:
Description:
KIT DEV RGB COLOR SENSOR 20-QFN
Manufacturer:
Avago Technologies US Inc.
Datasheet:

Part Number:
Description:
KIT DEV RGB DCS 2.2X2.2
Manufacturer:
Avago Technologies US Inc.
Datasheet:

Part Number:
Description:
Optical Sensor
Manufacturer:
Avago Technologies US Inc.
Datasheet:
Part Number:
Description:
RGB COLOR CONTROLLER AND SENSOR
Manufacturer:
Avago Technologies US Inc.
Part Number:
Description:
Photodiodes Color Controller
Manufacturer:
Avago Technologies US Inc.

Part Number:
Description:
Optical Sensors - Board Mount RGB Color Sensor
Manufacturer:
Avago Technologies US Inc.

Part Number:
Description:
Optical Sensors - Board Mount RGB Color Sensor
Manufacturer:
Avago Technologies US Inc.

Part Number:
Description:
Optical Sensor Development Tools RGB CONTROLLER Development Kit
Manufacturer:
Avago Technologies US Inc.

Part Number:
Description:
Optical Sensor Development Tools RGB CONTROLLER Development Kit
Manufacturer:
Avago Technologies US Inc.

Part Number:
Description:
OPTOCOUPLER GATE DRV 2A 16-SOIC
Manufacturer:
Avago Technologies US Inc.
Datasheet:
Part Number:
Description:
OPTOCOUPLER 2CH 2.5A 16-SOIC
Manufacturer:
Avago Technologies US Inc.
Datasheet:

Part Number:
Description:
OPTOCOUPLER GATE DRV 0.4A 16SOIC
Manufacturer:
Avago Technologies US Inc.
Datasheet:

Part Number:
Description:
OPTOCOUPLER 2.0A 250KHZ 8-DIP
Manufacturer:
Avago Technologies US Inc.
Datasheet:

Part Number:
Description:
OPTOCOUPLER 2.0A 250KHZ GW 8-SMD
Manufacturer:
Avago Technologies US Inc.
Datasheet: