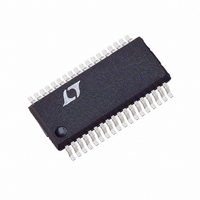
LTC1603CG Linear Technology, LTC1603CG Datasheet - Page 16

LTC1603CG
Manufacturer Part Number
LTC1603CG
Description
IC ADC W/SHUTDOWN 16BIT 36-SSOP
Manufacturer
Linear Technology
Datasheet
1.LTC1603CGPBF.pdf
(20 pages)
Specifications of LTC1603CG
Number Of Bits
16
Sampling Rate (per Second)
250k
Data Interface
Parallel
Number Of Converters
1
Power Dissipation (max)
350mW
Voltage Supply Source
Analog and Digital, Dual ±
Operating Temperature
0°C ~ 70°C
Mounting Type
Surface Mount
Package / Case
36-SSOP (0.200", 5.30mm Width)
Lead Free Status / RoHS Status
Contains lead / RoHS non-compliant
Available stocks
Company
Part Number
Manufacturer
Quantity
Price
Part Number:
LTC1603CG#PBF
Manufacturer:
LINEAR/凌特
Quantity:
20 000
APPLICATIONS
LTC1603
DC PERFORMANCE
The noise of an ADC can be evaluated in two ways: signal-
to-noise raio (SNR) in frequency domain and histogram in
time domain. The LTC1603 excels in both. Figure 18a
demonstrates that the LTC1603 has an SNR of over 90dB
in frequency domain. The noise in the time domain histo-
gram is the transition noise associated with a high resolu-
tion ADC which can be measured with a fixed DC signal
applied to the input of the ADC. The resulting output codes
are collected over a large number of conversions. The
shape of the distribution of codes will give an indication of
the magnitude of the transition noise. In Figure 17 the
distribution of output codes is shown for a DC input that
has been digitized 4096 times. The distribution is Gaussian
and the RMS code transition noise is about 0.66LSB. This
corresponds to a noise level of 90.9dB relative to full scale.
Adding to that the theoretical 98dB of quantization error
for 16-bit ADC, the resultant corresponds to an SNR level
of 90.1dB which correlates very well to the frequency
domain measurements in DYNAMIC PERFORMANCE
section.
DYNAMIC PERFORMANCE
The LTC1603 has excellent high speed sampling capabil-
ity. Fast fourier transform (FFT) test techniques are used
to test the ADC’s frequency response, distortions and
noise at the rated throughput. By applying a low distortion
sine wave and analyzing the digital output using an FFT
algorithm, the ADC’s spectral content can be examined for
frequencies outside the fundamental. Figures 18a and 18b
show typical LTC1603 FFT plots.
16
CIRCUITRY
ANALOG
INPUT
U
+
–
INFORMATION
U
1
2
A
A
IN
IN
+
–
V
REF
2.2 F
3
W
REFCOMP
Figure 16. Power Supply Grounding Practice
47 F
4
AGND
5 TO 8
U
V
SS
10 F
34
AV
LTC1603
DD
10 F
36
AV
DD
10 F
35
Figure 18a. This FFT of the LTC1603’s Conversion of a
Full-Scale 10kHz Sine Wave Shows Outstanding Response
with a Very Low Noise Floor When Sampling at 250ksps
DV
DD
10 F
9
–140
–100
–120
2500
2000
1500
1000
Figure 17. Histogram for 4096 Conversions
–20
–60
DGND
–40
–80
500
0
0
10
0
–5 –4 –3 –2 –1 0
OV
20
DD
10 F
29
OGND
40
FREQUENCY (kHz)
28
60
CODE
1603 F16
1
f
f
SINAD = 90.2dB
THD = –103.2dB
80
SAMPLE
IN
DIGITAL
SYSTEM
= 9.959kHz
2
100
= 250kHz
3
1603 F18a
4
1603 F17
120
5
1603f


