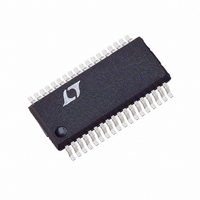
LTC1603IG#TR Linear Technology, LTC1603IG#TR Datasheet - Page 17

LTC1603IG#TR
Manufacturer Part Number
LTC1603IG#TR
Description
IC CONV A/D 16BIT 250KSPS 36SSOP
Manufacturer
Linear Technology
Datasheet
1.LTC1603CGPBF.pdf
(20 pages)
Specifications of LTC1603IG#TR
Number Of Bits
16
Sampling Rate (per Second)
250k
Data Interface
Parallel
Number Of Converters
1
Power Dissipation (max)
350mW
Voltage Supply Source
Analog and Digital, Dual ±
Operating Temperature
-40°C ~ 85°C
Mounting Type
Surface Mount
Package / Case
36-SSOP (0.200", 5.30mm Width)
Lead Free Status / RoHS Status
Contains lead / RoHS non-compliant
Available stocks
Company
Part Number
Manufacturer
Quantity
Price
APPLICATIONS
Signal-to-Noise Ratio
The signal-to-noise plus distortion ratio [S/(N + D)] is the
ratio between the RMS amplitude of the fundamental input
frequency to the RMS amplitude of all other frequency
components at the A/D output. The output is band limited
to frequencies from above DC and below half the sampling
frequency. Figure 18a shows a typical spectral content
with a 250kHz sampling rate and a 5kHz input. The
dynamic performance is excellent for input frequencies up
to and beyond the Nyquist limit of 125kHz.
Effective Number of Bits
The effective number of bits (ENOBs) is a measurement of
the resolution of an ADC and is directly related to the
S/(N + D) by the equation:
where N is the effective number of bits of resolution and
S/(N + D) is expressed in dB. At the maximum sampling
rate of 250kHz the LTC1603 maintains above 14 bits up to
the Nyquist input frequency of 125kHz (refer to Figure 19).
Total Harmonic Distortion
Total harmonic distortion (THD) is the ratio of the RMS
sum of all harmonics of the input signal to the fundamental
itself. The out-of-band harmonics alias into the frequency
band between DC and half the sampling frequency. THD is
expressed as:
where V1 is the RMS amplitude of the fundamental fre-
quency and V2 through Vn are the amplitudes of the
second through nth harmonics. THD vs Input Frequency is
shown in Figure 20. The LTC1603 has good distortion
performance up to the Nyquist frequency and beyond.
N = [S/(N + D) – 1.76]/6.02
THD
20
Log
V
U
2
2
INFORMATION
V
U
3
2
V
1
V
4
2
W
Vn
2
U
Figure 19. Effective Bits and Signal/(Noise + Distortion)
vs Input Frequency
Figure 18b. Even with Inputs at 100kHz, the LTC1603’s
Dymanic Linearity Remains Robust
–140
–100
–120
–100
–110
–20
–60
–80
Figure 20. Distortion vs Input Frequency
–40
16
15
14
13
12
11
10
–10
–20
–30
–40
–50
–60
–70
–80
–90
9
8
0
0
1k
0
1k
f
f
SINAD = 89dB
THD = –96dB
SAMPLE
IN
= 97.152kHz
20
= 250kHz
INPUT FREQUENCY (Hz)
40
10k
10k
FREQUENCY (kHz)
FREQUENCY (Hz)
60
80
100k
100k
100
1603 F18b
1603 F19
2ND
THD
3RD
1603 F20
120
LTC1603
1M
1M
98
92
86
80
74
68
62
56
50
17
1603f


