PAXCDC10 Red Lion Controls, PAXCDC10 Datasheet - Page 19
PAXCDC10
Manufacturer Part Number
PAXCDC10
Description
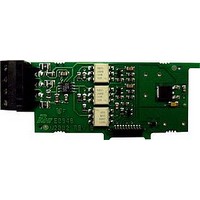
RS485 Serial Communications Output Interface Card With Terminal Block
Manufacturer
Red Lion Controls
Specifications of PAXCDC10
Accessory Type
RS485 Serial Communications Output Interface Card With Terminal Block
Brand/series
PAX Series
Card Type
RS485 Serial Communications Output Card
Data Rate
7⁄8 Bits
Standards
cULus Listed, CSA Certified and CE Marked
Voltage, Working
50 V
Pax Label Kit
189 Different Engineering Units, Labels Inserted Inside the Unit
For Use With
Red Lion PAX Digital Input Panel Meters
Lead Free Status / RoHS Status
Lead free / RoHS Compliant


using the arrow keys. Rate Input values for scaling points can be entered by
using the Key-in or the Applied method described below.
Key-in Method:
Display value (
pulses per second (Hz).
Applied Method:
Input Value (
applied input frequency (in Hz) will appear on the display. (To verify correct
reading wait for at least the length of the Low Update Time. Then press and
hold the F1 and F2 keys at the same time again. The new value should be ±
0.1% of the previous entered value.) Press PAR to enter the displayed
frequency as the Rate Input value. To prevent the displayed value from being
entered, press DSP. This will take the meter out of Programming Mode and the
previous Rate Input value will remain.
increment selected (e.g. rounding of ‘5’ causes 122 to round to 120 and 123 to
round to 125). Rounding starts at the least significant digit of the Rate display.
falls below the value entered.
entered amount of time, the meter will capture that Rate value as the new
Maximum value. A delay time helps to avoid false captures of sudden short
spikes. Maximum detection will only function if Rate is assigned to Input A or
B. The Maximum rate value is shown with an annunciator of ‘
and will continue to function independent of being displayed.
amount of time, the meter will capture that Rate value as the new Minimum
value. A delay time helps to avoid false captures of sudden short spikes.
Minimum detection will only function if Rate is assigned to Input A or B. The
Minimum rate value is shown with an annunciator of ‘
continue to function independent of being displayed.
RATE DISPLAY EXCEEDED
Rate display (5 digits, 99999), then the display will indicate an overflow
condition by showing “
and Maximum rate values will stay at their values even during resets.
*
Factory Setting can be used without affecting basic start-up.
Enter the corresponding Rate Input Value for the second Scaling Point by
Enter the Rate Input value (
Apply an external rate signal to the appropriate input terminals. At the Rate
Rounding values other than one round the Rate display to the nearest
The Low Cut Out value forces the Rate display to zero when the Rate display
When the Rate value is above the present Maximum rate value for the
When the Rate value is below the present Minimum rate value for the entered
If the rate of the input signal causes a display that exceeds the capacity of the
RATE INPUT VALUE FOR SCALING POINT 2
MAXIMUM CAPTURE DELAY TIME *
MINIMUM CAPTURE DELAY TIME *
) press and hold the F1 and F2 keys at the same time. The
) by pressing the F1 or F2 keys. This value is always in
RATE DISPLAY ROUND *
to
LOW CUT OUT *
to
to
to
”. During this overflow condition, the Minimum
) that corresponds to the entered Rate
seconds
seconds
’ in the display and will
’ in the display
19
RATE SCALING
Input value. (The Display and Input values can be entered by Key-in or Applied
Methods.) These values are internally plotted to a Display value of 0 and Input
value of 0 Hz. A linear relationship is formed between these points to yield a
rate display value that corresponds to the incoming input signal rate. The PAXI
and PAXR are capable of showing a rate display value for any linear process.
KEY-IN SCALING METHOD CALCULATION
those values can be entered into Scaling Display (
(
known, then it can be entered as the Scaling Input value and the Scaling Display
value will be entered as the following:
NOTES:
EXAMPLE:
INPUT FREQUENCY CALCULATION
edges received during a sample period of time. The sample period begins on the
first falling edge. At this falling edge, the meter starts accumulating time
towards Low Update and High Update values. Also, the meter starts
accumulating the number of falling edges. When the time reaches the Low
Update Time value, the meter looks for one more falling edge to end the sample
period. If a falling edge occurs (before the High Update Time value is reached),
the Rate display will update to the new value and the next sample period will
start on the same edge. If the High Update Time value is reached (without
receiving a falling edge after reaching Low Update Time), then the sample
period will end but the Rate display will be forced to zero. The High Update
Time value must be greater than the Low Update Time value. Both values must
be greater than 0.0. The input frequency calculated during the sample period, is
then shown as a Rate value determined by either scaling method.
To scale the Rate, enter a Scaling Display value with a corresponding Scaling
If a display value versus input signal (in pulses per second) is known, then
If only the number of pulses per ‘single’ unit (i.e. # of pulses per foot) is
1. If # of pulse per unit is less than 10, then multiply both Input and Display
2. If # of pulse per unit is less than 1, then multiply both Input and Display
3. If the Display value is raised or lowered, then Input value must be raised
4. Both values must be greater than 0.0.
1. With 15.1 pulses per foot, show feet per minute in tenths. Scaling Display
2. With 0.25 pulses per gallon, show whole gallons per hour. (To have greater
The meter determines the input frequency by summing the number of falling
values by 10.
values by 100.
or lowered by the same proportion (i.e. Display value for per hour is
entered by a third less (1200) then Input value is a third less of # of pulses
per unit). The same is true if the Input value is raised or lowered, then
Display value must be raised or lowered by the same proportion.
= 60.0 Scaling Input = 15.1.
accuracy, multiply both Input and Display values by 10.) Scaling Display
= 36000 Scaling Input = 2.5.
x
). No further calculations are needed.
RATE PER
Second
Minute
Hour
DISPLAY (
3600
60
1
x
)
# of pulses per unit
# of pulses per unit
# of pulses per unit
INPUT (
x
) and Scaling Input
x
)
Related parts for PAXCDC10
Image
Part Number
Description
Manufacturer
Datasheet
Request
R

Part Number:
Description:
Counter
Manufacturer:
Red Lion Controls
Datasheet:
Part Number:
Description:
Miniature Length Sensor
Manufacturer:
Red Lion Controls
Datasheet:
Part Number:
Description:
Model Lsc - Single Channel Output Length Sensor
Manufacturer:
Red Lion Controls
Datasheet: