HMPP-389T-TR1 Avago Technologies US Inc., HMPP-389T-TR1 Datasheet - Page 9
HMPP-389T-TR1
Manufacturer Part Number
HMPP-389T-TR1
Description
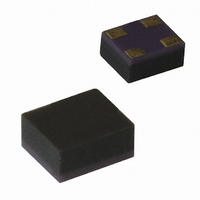
DIODE PIN SWITCH 100V 1A MINIPAK
Manufacturer
Avago Technologies US Inc.
Datasheet
1.HMPP-3890-TR1.pdf
(13 pages)
Specifications of HMPP-389T-TR1
Package / Case
4-MiniPak (1412)
Diode Type
PIN - Single
Voltage - Peak Reverse (max)
100V
Current - Max
1A
Capacitance @ Vr, F
0.3pF @ 5V, 1MHz
Resistance @ If, F
2.5 Ohm @ 5mA, 100MHz
Configuration
Single Dual Common Anode Dual Common Cathode
Reverse Voltage
100 V
Forward Continuous Current
1 A
Frequency Range
SHF
Termination Style
SMD/SMT
Carrier Life
0.2 us
Maximum Diode Capacitance
0.3 pF @ 5 V
Maximum Operating Temperature
+ 150 C
Maximum Series Resistance @ Maximum If
2.5 Ohm @ 5 mA
Maximum Series Resistance @ Minimum If
3.8 Ohm (Typ) @ 1 mA
Minimum Operating Temperature
- 65 C
Mounting Style
SMD/SMT
Lead Free Status / RoHS Status
Contains lead / RoHS non-compliant
Power Dissipation (max)
-
Lead Free Status / Rohs Status
Lead free / RoHS Compliant
Available stocks
Company
Part Number
Manufacturer
Quantity
Price
Company:

Part Number:
HMPP-389T-TR1
Manufacturer:
AVAGO
Quantity:
9 000
Part Number:
HMPP-389T-TR1
Manufacturer:
AVAGO/安华高
Quantity:
20 000


Insertion loss of the reference was very low and generally,
increased with frequency (Figure 21). If the demo-board
has been constructed carefully, there should not be any
evidence of resonance. The reference line’s insertion loss
trace can be stored in the VNA’s display memory and
used to correct for the insertion loss of the test line in the
subsequent measurements.
Figure 1. Insertion loss of reference line.
To evaluate the HMPP-389T as shunt switch, it was
mounted on the test line and then the appropriate bias-
ing voltage was applied. In our prototype, the worst case
return loss was 10 dB at 5 GHz (Figure 22). The return loss
varied very little when the bias was changed from zero
to -20V.
Figure . Return loss of HMPP-389T mounted on test line at 0V and -0V
bias.
Normalization was used to remove the pcb’s and connec-
tors’ losses from the measurement of the shunt switch’s
loss. The active trace was divided by the memorized
trace (Data/Memory) to produce the normalized data.
At zero bias, the insertion loss was under 0.6 dB up to 6
GHz (Figure 23). Applying a reverse bias to the PIN diode
has the effect of reducing its parasitic capacitance. With a
reverse bias of -20V, the insertion loss improved to better
than 0.5 dB (Figure 24).
9
Figure 16. Insertion Loss of Reference
Line.
Figure 17. Return Loss of HMPP-389T
Mounted on Test Line at 0V and -20V Bias.
-0.2
-0.4
-0.6
-0.8
-1.0
-15
-25
-35
-45
-55
-5
0
1
1
2
2
FREQUENCY (GHz)
FREQUENCY (GHz)
3
3
4
4
5
5
6
6
Figure 3. Insertion loss of HMPP-389T at 0V.
Figure 4. Insertion loss of HMPP-389T at -0V.
The PIN diode’s resistance is a function of the bias current.
So, at higher forward current, the isolation improved.
The combination of the HMPP-389T and the SK063A
demoboard exhibited more than 17 dB of isolation from
1 to 6 GHz at If ≥ 1mA (Figure 25).
Figure 5. Isolation at different frequencies with forward current as a
parameter.
The combination of the HMPP-389T and the demo-board
allows a high performance shunt switch to be constructed
swiftly and economically. The extremely low parasitic
inductance of the package allows the switch to operate
over a very wide frequency range.
Figure 20. Isolation at Different Frequencies
with Forward Current as a Parameter.
Figure 18. Insertion Loss of HMPP-389T at
0V.
Figure 19. Insertion Loss of HMPP-389T at
-20V.
-0.2
-0.4
-0.6
-0.8
-1.0
-0.2
-0.4
-0.6
-0.8
-1.0
-10
-14
-18
-22
-26
-30
0
0
1
1
1
0.15 mA
0.25 mA
0.5 mA
1 mA
1.5 mA
20 mA
2
2
2
FREQUENCY (GHz)
FREQUENCY (GHz)
FREQUENCY (GHz)
3
3
3
4
4
4
5
5
5
6
6
6
Related parts for HMPP-389T-TR1
Image
Part Number
Description
Manufacturer
Datasheet
Request
R

Part Number:
Description:
DIODE PIN GP 50V 1A MINIPAK
Manufacturer:
Avago Technologies US Inc.
Datasheet:
Part Number:
Description:
DIODE PIN SWITCH 100V 1A MINIPAK
Manufacturer:
Avago Technologies US Inc.
Datasheet:

Part Number:
Description:
DIODE PIN RF SGL 50V 1A MINIPAK
Manufacturer:
Avago Technologies US Inc.
Datasheet:
Part Number:
Description:
DIODE PIN SGL 100V 1A MINIPAK
Manufacturer:
Avago Technologies US Inc.
Datasheet:

Part Number:
Description:
DIODE PIN RF SGL 50V 1A MINIPAK
Manufacturer:
Avago Technologies US Inc.
Datasheet:

Part Number:
Description:
DIODE PIN SGL 100V 1A MINIPAK
Manufacturer:
Avago Technologies US Inc.
Datasheet:
Part Number:
Description:
DIODE PIN SHUNT 100V 1A MINIPAK
Manufacturer:
Avago Technologies US Inc.
Datasheet:
Part Number:
Description:
DIODE PIN SHUNT 100V 1A MINIPAK
Manufacturer:
Avago Technologies US Inc.
Datasheet:
Part Number:
Description:
DIODE PIN GP 50V 1A MINIPAK
Manufacturer:
Avago Technologies US Inc.
Datasheet:
Part Number:
Description:
DIODE PIN GP 50V 1A MINIPAK
Manufacturer:
Avago Technologies US Inc.
Datasheet:

Part Number:
Description:
OPTOCOUPLER GATE DRV 2A 16-SOIC
Manufacturer:
Avago Technologies US Inc.
Datasheet:
Part Number:
Description:
OPTOCOUPLER 2CH 2.5A 16-SOIC
Manufacturer:
Avago Technologies US Inc.
Datasheet:

Part Number:
Description:
OPTOCOUPLER GATE DRV 0.4A 16SOIC
Manufacturer:
Avago Technologies US Inc.
Datasheet:

Part Number:
Description:
OPTOCOUPLER 2.0A 250KHZ 8-DIP
Manufacturer:
Avago Technologies US Inc.
Datasheet:

Part Number:
Description:
OPTOCOUPLER 2.0A 250KHZ GW 8-SMD
Manufacturer:
Avago Technologies US Inc.
Datasheet: