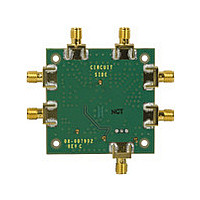
AD8349-EVAL Analog Devices Inc, AD8349-EVAL Datasheet - Page 22

AD8349-EVAL
Manufacturer Part Number
AD8349-EVAL
Description
Manufacturer
Analog Devices Inc
Datasheet
1.AD8349-EVAL.pdf
(28 pages)
Specifications of AD8349-EVAL
Lead Free Status / Rohs Status
Not Compliant
AD8349
GSM/EDGE APPLICATION
Figure 62 and Figure 64 show plots of GMSK error vector
magnitude (EVM), spectral performance, and noise floor
(dBc/100 kHz at 6 MHz carrier offset) at 885 MHz and
1960 MHz. Based on spectral performance, a maximum output
power level of around 2 dBm is appropriate. Note, however, that
as the output power decreases below this level, there is only a
very slight increase in the dBc noise floor. This indicates that
baseband drive variation can be used to control or correct the
gain of the signal chain over a range of at least 5 dB, with little
or no SNR penalty.
Figure 63 and Figure 65 show plots of 8-PSK EVM, spectral
performance, and noise floor at 885 MHz and 1960 MHz.
An LO drive level of approximately –6 dBm is recommended
for GMSK and 8-PSK. A higher LO drive power will improve
the noise floor slightly; however, it also tends to degrade EVM.
Figure 61. 4-Carrier WCDMA Adjacent and Alternate Channel Power Ratio
–100
–105
–110
–54
–55
–56
–57
–58
–59
–60
–61
–62
–63
–64
–65
–66
–50
–55
–60
–65
–70
–75
–80
–85
–90
–95
–29 –28 –27 –26 –25 –24 –23 –22 –21 –20 –19 –18 –17
Figure 62.GMSK EVM, Spectral Performance, and Noise Floor
–10
and 50 MHz Noise Floor (dBm/Hz) vs. Per-Channel Power
1960 NOISE
2140 NOISE
–8
PEAK NOISE FLOOR
vs. Channel Power (Frequency = 885 MHz)
–6
EVM
at 1960 MHz and 2140 MHz
CHANNEL POWER (dBm)
CHANNEL POWER (dBm)
–4
2140 ALT CPR
1960 ADJ CPR
AVERAGE NOISE FLOOR
–2
2140 ADJ CPR
0
1960 ALT CPR
2
400kHz
600kHz
4
6
–144
–146
–148
–150
–152
–154
–156
4.0
3.5
3.0
2.5
2.0
1.5
1.0
Rev. A | Page 22 of 28
Figure 65. 8-PSK EVM, Spectral Performance, and Noise Floor vs. Channel
–100
–105
–110
–100
–105
–110
–100
–105
–110
–50
–55
–60
–65
–70
–75
–80
–85
–90
–95
–50
–55
–60
–65
–70
–75
–80
–85
–90
–95
–50
–55
–60
–65
–70
–75
–80
–85
–90
–95
Figure 63. 8-PSK EVM, Spectral Performance, and Noise Floor
Figure 64. GMSK EVM, Spectral Performance, and Noise Floor
–14
–13
–14
PEAK NOISE FLOOR
–12
–11
–12
vs. Channel Power (Frequency = 1960 MHz)
vs. Channel Power (Frequency = 885 MHz)
PEAK NOISE FLOOR
–10
–9
Power (Frequency = 1960 MHz)
–10
600kHz
AVERAGE NOISE FLOOR
CHANNEL POWER (dBm)
CHANNEL POWER (dBm)
CHANNEL POWER (dBm)
–8
–7
600kHz
–8
AVERAGE NOISE FLOOR
–6
–5
AVERAGE NOISE FLOOR
EVM
–6
–4
–3
PEAK NOISE FLOOR
EVM
–4
–2
–1
EVM
400kHz
400kHz
–2
0
1
600kHz
400kHz
0
2
3
2
4
5
4.0
3.5
3.0
2.5
2.0
1.5
1.0
4.0
3.5
3.0
2.5
2.0
1.5
1.0
4.0
3.5
3.0
2.5
2.0
1.5
1.0


