TOOLSTICK582DC Silicon Laboratories Inc, TOOLSTICK582DC Datasheet - Page 7
TOOLSTICK582DC
Manufacturer Part Number
TOOLSTICK582DC
Description
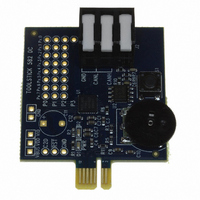
DAUGHTER CARD TOOLSTICK F582
Manufacturer
Silicon Laboratories Inc
Series
ToolStickr
Specifications of TOOLSTICK582DC
Accessory Type
Daughter Card
Processor To Be Evaluated
C8051F58
Interface Type
USB
Operating Supply Voltage
2.7 V to 3.6 V
Lead Free Status / RoHS Status
Lead free / RoHS Compliant
For Use With/related Products
*
For Use With
336-1345 - TOOLSTICK BASE ADAPTER336-1182 - ADAPTER USB DEBUG FOR C8051FXXX
Lead Free Status / Rohs Status
Lead free / RoHS Compliant
Other names
336-1584
Available stocks
Company
Part Number
Manufacturer
Quantity
Price
Company:

Part Number:
TOOLSTICK582DC
Manufacturer:
Silicon Labs
Quantity:
135


6.2. Connecting to the Device and Downloading Firmware
This section describes how to open the IDE, open and build a project, connect to a device and download the
firmware.
1. Open the Silicon Laboratories IDE from the Start Programs Silicon Laboratories menu.
2. In the IDE, go to Project Open Project.
3. Browse to C:\SiLabs\MCU\ToolStick\F582DC\Firmware\.
4. Select F582DC_FeaturesDemo.wsp and click OK.
5. In the IDE, select Project Rebuild Project.
6. Go to Options Connection Options.
7. Select “USB Debug Adapter” for the Serial Adapter and “C2” for the Debug Interface, and then click “OK”.
8. Go to Debug Connect.
9. Download the code using the download button on the menu bar or use alt-D.
Once these steps are completed, the firmware is built into an object file (step 5) and downloaded to the device
(step 9). The device is now ready to begin executing code. If all of these steps are followed successfully, the “Go”
option is enabled in the Debug menu. A green circle icon in the IDE toolbar also indicates that the device is ready
to run. If one of the steps leads to an error, make sure that the ToolStick is properly inserted in a USB port and start
again with step 6.
6.3. Running and Stopping Code Execution
Once the IDE is connected to the device and the firmware is loaded, the IDE can start and stop the code execution.
The following steps can be performed using the buttons on the toolbar or using the options in the Debug menu.
1. To start code execution, click the green “Go” button on the toolbar or use the Debug Go menu option. The
2. To stop code execution, click the red “Stop” button on the toolbar or use the Debug Stop menu option. The
All debug windows and watch windows are refreshed when the device is stopped. If any of the values in these
windows have changed since the last time the device was halted, the new value is shown in red text instead of
black text.
green LED on the daughter card will start to flash. The debug commands in the IDE (single-step, multiple-step,
set breakpoint, and others) are disabled when the device is running. While the firmware is running, the
potentiometer on the daughter card can be rotated to alter the blinking speed of the LED. The button labeled S1
can also be pressed to toggle the ADC on and off. When the ADC is off, the blink rate or brightness of the LED will
not change with the potentiometer.
device will halt code execution and all of the registers and pins on the device will hold their state.
Rev. 0.1
ToolStick-F582DC
7
Related parts for TOOLSTICK582DC
Image
Part Number
Description
Manufacturer
Datasheet
Request
R

Part Number:
Description:
KIT TOOL EVAL SYS IN A USB STICK
Manufacturer:
Silicon Laboratories Inc
Datasheet:

Part Number:
Description:
TOOLSTICK DEBUG ADAPTER
Manufacturer:
Silicon Laboratories Inc
Datasheet:

Part Number:
Description:
TOOLSTICK BASE ADAPTER
Manufacturer:
Silicon Laboratories Inc
Datasheet:

Part Number:
Description:
TOOLSTICK DAUGHTER CARD
Manufacturer:
Silicon Laboratories Inc
Datasheet:

Part Number:
Description:
TOOLSTICK DAUGHTER CARD
Manufacturer:
Silicon Laboratories Inc
Datasheet:

Part Number:
Description:
TOOLSTICK DAUGHTER CARD
Manufacturer:
Silicon Laboratories Inc
Datasheet:

Part Number:
Description:
TOOLSTICK PROGRAMMING ADAPTER
Manufacturer:
Silicon Laboratories Inc
Datasheet:

Part Number:
Description:
TOOLSTICK DAUGHTER CARD
Manufacturer:
Silicon Laboratories Inc
Datasheet:

Part Number:
Description:
KIT STARTER TOOLSTICK
Manufacturer:
Silicon Laboratories Inc
Datasheet:

Part Number:
Description:
KIT UNIVERSITY TOOLSTICK STARTER
Manufacturer:
Silicon Laboratories Inc
Datasheet:

Part Number:
Description:
DAUGHTER CARD TOOLSTICK F330
Manufacturer:
Silicon Laboratories Inc
Datasheet:

Part Number:
Description:
CARD DAUGHTER UNIVRSTY TOOLSTICK
Manufacturer:
Silicon Laboratories Inc
Datasheet:

Part Number:
Description:
DAUGHTER CARD TOOLSTICK F500
Manufacturer:
Silicon Laboratories Inc
Datasheet:

Part Number:
Description:
DAUGHTER CARD TOOLSTICK F540
Manufacturer:
Silicon Laboratories Inc
Datasheet:

Part Number:
Description:
DAUGHTER CARD TOOLSTICK F560
Manufacturer:
Silicon Laboratories Inc
Datasheet: