EVAL-AD7877EBZ Analog Devices Inc, EVAL-AD7877EBZ Datasheet - Page 7
EVAL-AD7877EBZ
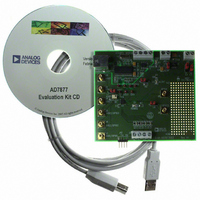
Manufacturer Part Number
EVAL-AD7877EBZ
Description
BOARD EVALUATION FOR AD7877
Manufacturer
Analog Devices Inc
Datasheets
1.AD7877ACBZ-REEL7.pdf
(44 pages)
2.EVAL-AD7877EBZ.pdf
(16 pages)
3.EVAL-AD7877EBZ.pdf
(44 pages)
Specifications of EVAL-AD7877EBZ
Main Purpose
Interface, Touch Screen Controller
Embedded
No
Utilized Ic / Part
AD7877
Primary Attributes
4-Wire Resistive Touch Screen Controller, SPI Interface, On-Chip: Temp Sensor, Voltage Reference, 8-Bit DAC
Secondary Attributes
USB GUI, LCD Noise Reduction Feature, 2.7 ~ 5.25 V, Wake Up on Touch Feature
Lead Free Status / RoHS Status
Lead free / RoHS Compliant


VISUAL DISPLAY SCREEN
Clicking on the Visual Display tab will bring the user to the
screen shown in Figure 6. Values measured by the AD7877 can
be graphed on this screen.
Selecting a Channel Measurement to Display
To select the measurement to be graphed, select one of the
channels from the list. The selected channel value will be
displayed on the left of the screen, along with the channel high
and low limits, if there are any. The limits may be changed
by dragging the limit bars up or down. The new limits are
automatically written to the relevant AD7877 registers by the
evaluation software.
The AUX1, BAT1, BAT2, and Temp1 channels all have upper
and lower limits. Also displayed next to these channels in the list
is an ALERT button. If the button is green, the channel’s mea-
sured value is within its limits. If the button is red, the channel’s
measured value is outside its limits and is causing the ALERT
interrupt to assert.
REV. Sp0
Figure 6. Visual Display Screen
–7–
In Figure 6, the Temp1 measurement is selected. The bar graph
shows the value in the Temp1 register. The upper limit in Figure 6
is set to 47.38°C, while the lower limit is set to 26.74°C. These
limits can be changed by clicking and dragging on the limit bars. In
Figure 6, the temperature breaches the lower temperature limit
and so an ALERT interrupt is triggered. The ALERT interrupt
indicator button long side Temp1 has changed from green to red
to reflect this.
Graphing a Measurement
On the right of the Visual Display screen is a graphing area.
What is graphed here depends on which channel is selected. If
any of the following is the selected channel, then all are graphed
in the graphing area: AUX1, AUX2, AUX3, BAT1, and BAT2.
If any of the touch screen measurement channels (X+, Y+, Y–,
or Z1) are selected, then all four channels are graphed. If either
of the temperature measurement channels is selected, then both
channels are displayed in the graphing area. Graphing more
than one channel at a time makes it easy for the user to compare
and contrast channel measurements.
In Figure 7, the Y+ measurement is selected. In the graphing
window, the four touch screen measurements are graphed.
EVAL-AD7877
Related parts for EVAL-AD7877EBZ
Image
Part Number
Description
Manufacturer
Datasheet
Request
R


Part Number:
Description:
BOARD EVAL FOR SI270X-A
Manufacturer:
Silicon Laboratories Inc
Datasheet:

Part Number:
Description:
BUCK CONV REF DESIGN KIT IP1201
Manufacturer:
International Rectifier
Datasheet:
Part Number:
Description:
BOARD DEMO SYNC DUAL BUCK CNVTER
Manufacturer:
International Rectifier
Datasheet:
Part Number:
Description:
BOARD DEMO SYNC BUCK CONVETER
Manufacturer:
International Rectifier
Datasheet:

Part Number:
Description:
EVALBOARD/EB Omnidirectional microphone - Analog
Manufacturer:
Analog Devices
Datasheet:
Part Number:
Description:
EVALBOARD/EB Omnidirectional microphone - Analog
Manufacturer:
Analog Devices
Datasheet:


Part Number:
Description:
BOARD EVAL LED DRIVER LT3756
Manufacturer:
Linear Technology
Datasheet:

Part Number:
Description:
BOARD EVAL FOR AD7741/7742
Manufacturer:
Analog Devices Inc
Datasheet:

Part Number:
Description:
±1.7g Dual-Axis IMEMS Accelerometer Evaluation Board
Manufacturer:
Analog Devices Inc
Datasheet:

Part Number:
Description:
IC MULTIPLIER ANALOG 8-SOIC T/R
Manufacturer:
Analog Devices Inc
Datasheet:

Part Number:
Description:
IC ANALOG MULTIPLIER 8-DIP
Manufacturer:
Analog Devices Inc
Datasheet:
Part Number:
Description:
IC ANALOG MULTIPLIER 8-SOIC
Manufacturer:
Analog Devices Inc
Datasheet:
Part Number:
Description:
IC ANALOG MULTIPLIER 8-DIP
Manufacturer:
Analog Devices Inc
Datasheet: