8.12.00 J-LINK ARM-PRO Segger Microcontroller Systems, 8.12.00 J-LINK ARM-PRO Datasheet - Page 191
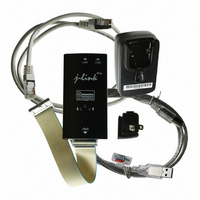
8.12.00 J-LINK ARM-PRO
Manufacturer Part Number
8.12.00 J-LINK ARM-PRO
Description
JTAG EMULATOR USB ETHERNET ARM
Manufacturer
Segger Microcontroller Systems
Type
Emulatorr
Specifications of 8.12.00 J-LINK ARM-PRO
Contents
Emulation Module
For Use With/related Products
ARM7, ARM9, ARM11, Cortex
Lead Free Status / RoHS Status
Lead free / RoHS Compliant
Other names
8.12.00 J-LINK ARM-PRO
899-1007
899-1007


9.2
9.2.1
9.2.2
9.2.3
J-Link / J-Trace (UM08001)
Embedded Trace Macrocell (ETM) provides comprehensive debug and trace facilities
for ARM processors. ETM allows to capture information on the processor's state with-
out affecting the processor's performance. The trace information is exported immedi-
ately after it has been captured, through a special trace port.
Microcontrollers that include an ETM allow detailed program execution to be recorded
and saved in real time. This information can be used to analyze program flow and
execution time, perform profiling and locate software bugs that are otherwise very
hard to locate. A typical situation in which code trace is extremely valuable, is to find
out how and why a "program crash" occurred in case of a runaway program count.
A debugger provides the user interface to J-Trace and the stored trace data. The
debugger enables all the ETM facilities and displays the trace information that has
been captured. J-Trace is seamlessly integrated into the IAR Embedded Workbench®
IDE. The advanced trace debugging features can be used with the IAR C-SPY debug-
ger.
The ETM can be configured in software to store trace information only after a specific
sequence of conditions. When the trigger condition occurs the trace capture stops
after a programmable period.
Code trace
Code tracing means that the processor outputs trace data which contain information
about the instructions that have been executed at last.
Data trace
Data tracing means that the processor outputs trace data about memory accesses
(read / write access to which address and which data has been read / stored). In
general, J-Trace supports data tracing, but it depends on the debugger if this option
is available or not. Note that when using data trace, the amount of trace data to be
captured rises enormously.
In the following a sample integration of J-Trace and the trace functionality on the
debugger side is shown. The sample is based on IAR’s EWARM integration of J-Trace.
Embedded Trace Macrocell (ETM)
Trigger condition
Code tracing and data tracing
J-Trace integration example - IAR EWARM
© 2004-2011 SEGGER Microcontroller GmbH & Co. KG
191
Related parts for 8.12.00 J-LINK ARM-PRO
Image
Part Number
Description
Manufacturer
Datasheet
Request
R

Part Number:
Description:
CONNECTOR JTAG-ARM ISOLATION
Manufacturer:
Segger Microcontroller Systems
Datasheet:

Part Number:
Description:
ADAPTER ARM TARGET 14PIN RIBBON
Manufacturer:
Segger Microcontroller Systems
Datasheet:

Part Number:
Description:
JTAG EMULATOR FOR ARM CORES
Manufacturer:
Segger Microcontroller Systems
Datasheet:

Part Number:
Description:
JTAG EMULATOR FOR ARM CORES
Manufacturer:
Segger Microcontroller Systems
Datasheet:

Part Number:
Description:
PROGRAMMING TOOL FOR MCU
Manufacturer:
Segger Microcontroller Systems
Datasheet:

Part Number:
Description:
PROGRAMMING TOOL FOR ST7 MCU
Manufacturer:
Segger Microcontroller Systems
Datasheet:

Part Number:
Description:
PROGRAMMING TOOL FOR STM8
Manufacturer:
Segger Microcontroller Systems
Datasheet:

Part Number:
Description:
PROGRAMMER JTAG FOR ARM CORES
Manufacturer:
Segger Microcontroller Systems
Datasheet:

Part Number:
Description:
JTAG EMULATOR ARM7/ARM9 ETM
Manufacturer:
Segger Microcontroller Systems
Datasheet:

Part Number:
Description:
EMULATOR JTAG/SWD CORTEX M3
Manufacturer:
Segger Microcontroller Systems
Datasheet: