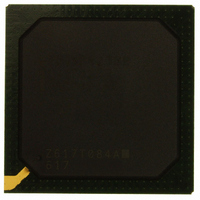
PRIXP423BB Intel, PRIXP423BB Datasheet - Page 31

PRIXP423BB
Manufacturer Part Number
PRIXP423BB
Description
IC NETWRK PROCESSR 266MHZ 492BGA
Manufacturer
Intel
Specifications of PRIXP423BB
Processor Type
Network
Features
XScale Core
Speed
266MHz
Voltage
1.3V
Mounting Type
Surface Mount
Package / Case
492-BGA
Core Operating Frequency
533MHz
Package Type
BGA
Pin Count
492
Mounting
Surface Mount
Operating Temperature (max)
85C
Operating Temperature (min)
-40C
Operating Temperature Classification
Industrial
Lead Free Status / RoHS Status
Lead free / RoHS Compliant
Other names
869741
Available stocks
Company
Part Number
Manufacturer
Quantity
Price
Workaround:
Status:
4.
Problem:
Workaround:
Status:
5.
Problem:
Intel
®
IXP42X Product Line of Network Processors and IXC1100 Control Plane Processor
Each of the preceding items may cause the performance monitoring count to increment several
times. The resulting performance monitoring count may be higher than expected when the
preceding items occur, but should never be lower than expected.
There is no way to obtain the correct number of cycles stalled due to instruction cache misses and
instruction TLB misses. Extra counts due to branch instructions mispredicted by the BTB may be
one component of the unwanted count that can be filtered out.
The number of mispredicted branches also can be monitored using performance monitoring event
0x6 during the same time period as event 0x1. To obtain a value closer to the correct one, the
mispredicted branch number can then be subtracted from the instruction cache stall number
generated by the performance monitor. This workaround only addresses counts contributed by
branches that the BTB is able to predict.
All the items in the preceding bulleted list still affect the count. Depending on the nature of the
code being monitored, this workaround may have limited value.
No
In Special Debug State, Back-to-Back Memory Operations — Where the First
Instruction Aborts — May Cause a Hang
When back-to-back memory operations occur in the Special Debug State (SDS, used by ICE and
Debug vendors) and the first memory operation gets a precise data abort, the first memory
operation is correctly cancelled and no abort occurs. Depending on the timing, however, the second
memory operation may not work correctly. The data cache may internally cancel the second
operation, but the register file may have score-boarded registers for that second memory operation.
The effect is that the core may hang (due to a permanently score-boarded register) or that a store
operation may be incorrectly cancelled.
In Special Debug State, any memory operation that may cause a precise data abort should be
followed by a write-buffer drain operation. This precludes further memory operations from being
in the pipe when the abort occurs. Load Multiple/Store Multiple that may cause precise data aborts
should not be used.
No
Accesses to the CP15 ID Register with Opcode2 > 0b001 Returns
Unpredictable Values
The ARM Architecture Reference Manual (ARM DDI 0100E) states the following in Chapter B-2,
Section 2.3:
When an <opcode2> value corresponding to an unimplemented or reserved ID register is
encountered, the System Control processor returns the value of the main ID register. ID registers
other than the main ID register are defined so that when implemented, their value cannot be equal
to that of the main ID register. Software can therefore determine whether they exist by reading both
the main ID register and the desired register and comparing their values. When the two values are
not equal, the desired register exists.
•
•
Fix.
Fix.
Some branch instructions, including indirect branches and those mispredicted by the BTB.
CP15 MCR instructions to registers 7, 8, 9, or 10, which involve the instruction cache or the
instruction TLB.
Core Errata
31


