DEMO9S08QB8 Freescale Semiconductor, DEMO9S08QB8 Datasheet - Page 24
DEMO9S08QB8
Manufacturer Part Number
DEMO9S08QB8
Description
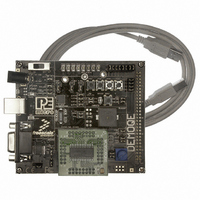
BOARD DEMO FOR 9S08 QB MCU
Manufacturer
Freescale Semiconductor
Type
MCUr
Specifications of DEMO9S08QB8
Contents
Board, Cable
Silicon Manufacturer
Freescale
Core Architecture
HCS08
Core Sub-architecture
HCS08
Silicon Core Number
MC9S08
Silicon Family Name
S08QB
Kit Contents
Board
Rohs Compliant
Yes
For Use With/related Products
MC9S08QB8
Lead Free Status / RoHS Status
Lead free / RoHS Compliant


5.5.1
20
Visual Components
All data to be displayed must be in hexadecimal format. The data can be
accepted and displayed either as incoming byte values ($00-$FF) or word
values ($0000-$FFFF). The data format indicates whether the data is byte or
word data. The graphical components automatically size their range
depending upon the incoming data.
The Bar Graph has four separate bars A, B, C, and D. On each bar a
percentage value is displayed which indicates the current value relative to the
full range. A byte value of $7F (max is $FF) would show up as approximately
50% as would a word value of $7FFF (max is $FFFF). As can be seen in the
data formatting section, all four bars must be written at the same time. The
bars are shown here:
The graphing component shows four waveforms X, Y, Z, and W. The
magnitude axis either has a range of $00-$FF (if byte values are incoming on
the serial port) or $0000-$FFFF (if word values are incoming). Each new set
of values which comes through the serial port is added to the far right side of
the graph and the rest of the data values move to the left. The vertical axis
displays the incoming data as the magnitude of each waveform, and the
horizontal axis displays the number of samples. The graph has a limited size,
Figure 5-5: Serial Grapher Bar Graph
DEMO9S08QB8 User Manual
Related parts for DEMO9S08QB8
Image
Part Number
Description
Manufacturer
Datasheet
Request
R

Part Number:
Description:
Manufacturer:
STMicroelectronics
Datasheet:

Part Number:
Description:
DEMO BOARD FOR HMC6042/HMC1041Z
Manufacturer:
Honeywell Microelectronics & Precision Sensors

Part Number:
Description:
DEMO BOARD FOR HMC1042L/HMC1041Z
Manufacturer:
Honeywell Microelectronics & Precision Sensors
Datasheet:

Part Number:
Description:
KIT DEMO 4 SENSOR CHAN RS232
Manufacturer:
VTI Technologies
Datasheet:


Part Number:
Description:
DEMO: DC Power Supply, 32 Volts, 3 Amps
Manufacturer:
Tektronix
Part Number:
Description:
DEMO: Programmable DC Power Supply, 32 Volts, 3 Amps
Manufacturer:
Tektronix

Part Number:
Description:
Manufacturer:
Freescale Semiconductor, Inc
Datasheet:
Part Number:
Description:
Manufacturer:
Freescale Semiconductor, Inc
Datasheet:
Part Number:
Description:
Manufacturer:
Freescale Semiconductor, Inc
Datasheet:
Part Number:
Description:
Manufacturer:
Freescale Semiconductor, Inc
Datasheet:
Part Number:
Description:
Manufacturer:
Freescale Semiconductor, Inc
Datasheet:
Part Number:
Description:
Manufacturer:
Freescale Semiconductor, Inc
Datasheet:
Part Number:
Description:
Manufacturer:
Freescale Semiconductor, Inc
Datasheet:
Part Number:
Description:
Manufacturer:
Freescale Semiconductor, Inc
Datasheet: