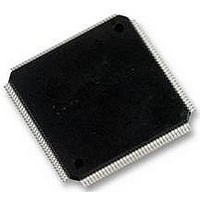
LPC2212FBD144 NXP Semiconductors, LPC2212FBD144 Datasheet - Page 25

LPC2212FBD144
Manufacturer Part Number
LPC2212FBD144
Description
16/32BIT MCU ARM7, 128K FLASH, 144LQFP
Manufacturer
NXP Semiconductors
Datasheet
1.LPC2212FBD144.pdf
(45 pages)
Specifications of LPC2212FBD144
No. Of I/o's
112
Ram Memory Size
16KB
Cpu Speed
60MHz
No. Of Timers
2
No. Of Pwm Channels
6
Digital Ic Case
RoHS Compliant
Core Size
32bit
Program Memory Size
128KB
Oscillator Type
External Only
Controller Family/series
LPC22xx
Rohs Compliant
Yes
Available stocks
Company
Part Number
Manufacturer
Quantity
Price
Company:
Part Number:
LPC2212FBD144,551
Manufacturer:
NXP Semiconductors
Quantity:
10 000
Company:
Part Number:
LPC2212FBD144/01,5
Manufacturer:
NXP Semiconductors
Quantity:
10 000
NXP Semiconductors
LPC2212_2214_4
Product data sheet
6.19.2 Embedded trace macrocell
6.19.3 RealMonitor
The ARM core has a Debug Communication Channel function built-in. The debug
communication channel allows a program running on the target to communicate with the
host debugger or another separate host without stopping the program flow or even
entering the debug state. The debug communication channel is accessed as a
co-processor 14 by the program running on the ARM7TDMI-S core. The debug
communication channel allows the JTAG port to be used for sending and receiving data
without affecting the normal program flow. The debug communication channel data and
control registers are mapped in to addresses in the EmbeddedICE logic.
The JTAG clock (TCK) must be slower than
interface to operate.
Since the LPC2212/2214 have significant amounts of on-chip memory, it is not possible to
determine how the processor core is operating simply by observing the external pins. The
Embedded Trace Macrocell (ETM) provides real-time trace capability for deeply
embedded processor cores. It outputs information about processor execution to the trace
port.
The ETM is connected directly to the ARM core and not to the main AMBA system bus. It
compresses the trace information and exports it through a narrow trace port. An external
trace port analyzer must capture the trace information under software debugger control.
Instruction trace (or PC trace) shows the flow of execution of the processor and provides a
list of all the instructions that were executed. Instruction trace is significantly compressed
by only broadcasting branch addresses as well as a set of status signals that indicate the
pipeline status on a cycle by cycle basis. Trace information generation can be controlled
by selecting the trigger resource. Trigger resources include address comparators,
counters and sequencers. Since trace information is compressed the software debugger
requires a static image of the code being executed. Self-modifying code can not be traced
because of this restriction.
RealMonitor is a configurable software module, developed by ARM Inc., which enables
real time debug. It is a lightweight debug monitor that runs in the background while users
debug their foreground application. It communicates with the host using the DCC (Debug
Communications Channel), which is present in the EmbeddedICE logic. The
LPC2212/2214 contain a specific configuration of RealMonitor software programmed into
the on-chip flash memory.
Rev. 04 — 3 January 2008
1
6
of the CPU clock (CCLK) for the JTAG
16/32-bit ARM microcontrollers
LPC2212/2214
© NXP B.V. 2008. All rights reserved.
25 of 45


