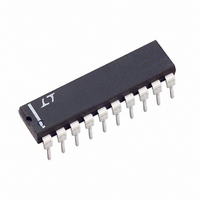
LTC1060CN Linear Technology, LTC1060CN Datasheet - Page 5

LTC1060CN
Manufacturer Part Number
LTC1060CN
Description
IC FILTER BUILDING BLOCK 20-DIP
Manufacturer
Linear Technology
Datasheet
1.LTC1060CNPBF.pdf
(20 pages)
Specifications of LTC1060CN
Filter Type
Universal Switched Capacitor
Frequency - Cutoff Or Center
30kHz
Number Of Filters
2
Max-order
4th
Voltage - Supply
±2.37 V ~ 5 V
Mounting Type
Through Hole
Package / Case
20-DIP (0.300", 7.62mm)
Lead Free Status / RoHS Status
Contains lead / RoHS non-compliant
Available stocks
Company
Part Number
Manufacturer
Quantity
Price
TYPICAL PERFOR A CE CHARACTERISTICS
–0.2
–0.2
1.0
0.8
0.2
1.0
0.8
0.6
0.4
0.6
0.4
0.2
10
20
20
10
0
0
0
0
0.2
0
Graph 10. Mode 1:
(f
0
Graph 16. Mode 3:
Q Error vs Clock Frequency
Graph 13. Mode 1: (f
f
V
T
f
CLK
CLK
CLK
50
A
f
S
0
Q = 50
0.4
= ±2.5V
Q = 5
= 25°C
100
20
50
= 100:1
V
V
/f
and Temperature
125°C
0.2
S
S
10
0
T
10
0.6
) vs f
= ±2.5V
= ±2.5V
A
= 25°C
200
20
Q = 5
85°C
Q = 20
50
0.4
0.8
Q = 5
CLK
300
f
20
f
f
CLK
CLK
CLK
1.0 1.2
V
50
V
10
and Q
S
S
Q = 10
0.6
20
(MHz)
(MHz)
(kHz)
= ±5V
= ±5V
Q = 5
400
10
–55°C
f
CLK
CLK
f
Q = 5
0.8
1.4 1.6 1.8
0
500
= 50:1
/f
W
T
f
CLK
A
f
0
V
Q = 10
f
0
CLK
f
) vs
S
= 25°C
0
LTC1060 • TPC13
LTC1060 • TPC10
LTC1060 • TPC16
= ±2.5V
1.0
600
= 100:1
= 50:1
U
700
1.2
2.0
120
100
80
60
20
40
0
–0.4
– 0.2
0
0.8
0.6
Graph 14. Mode 1:
Notch Depth vs Clock Frequency
0.4
0.2
10
20
20
10
Q = 10
100:1 Q = 1
0
0
0
0.2
0
Graph 11. Mode 1:
(f
Graph 17. Mode 3 (R2 = R4):
Q Error vs Clock Frequency
0.2
V
T
f
CLK
Q = 50
Q = 20
Q = 10
Q = 5
V
T
f
CLK
A
f
CLK
S
f
0
S
A
0
0.4
= ±2.5V
= 25°C
100
100:1
= 25°C
= ±7.5V
= 50:1
/f
0.4
= 100:1
0
0.6
) vs f
200
Q = 10
0.6
50:1
f
0.8
CLK
CLK
0.8
50
300
f
f
(MHz)
CLK
CLK
1.0 1.2
and Q
(MHz)
(MHz)
1.0
400
10
50
V
T
V
Q = 5
f
S
A
IN
1.2
CLK
1.4 1.6 1.8
f
= ±5V
0
500
= 25°C
10
= 1V
LTC1060 • TPC14
= 50:1
1.4
RMS
LTC1060 • TPC11
LTC1060 • TPC17
Q = 5
600
1.6
700
2.0
–0.2
–0.3
–0.4
–0.5
–0.1
–20
–20
0.1
0.8
0.6
0.4
0.2
40
20
40
20
0
1
0
0
0
0.1
0.2
Graph 12. Mode 1: (f
and Temperature
0
Graph 15. Mode 3: Deviation of
(f
Measurement
Graph 18. Mode 3 (R2 = R4):
Measured Q vs f
Temperature
f
V
Q = 10
f
V
T
PIN 12 AT 100:1
V
Q = 10
f
CLK
CLK
CLK
CLK
f
A
f
f
S
S
S
0
0
0
= ±5V
= ±5V
= ±2.5V
= 25°C
0.4
= 50:1
= 100:1
= 100:1
0.2
/f
0
125°C
) with Respect to Q = 10
0.6
125°C
125°C
0.4
1
0.8
(A)
(B)
85°C
85°C
f
f
CLK
CLK
IDEAL Q
T
LTC1060
A
1.0
0.6
CLK
85°C
(MHz)
(kHz)
= 25°C
f
f
CLK
CLK
f
f
O
O
T
and
1.2
A
CLK
0.8
R2
R4
R2
R4
10
= 25°C
= 500: 1
= 200: 1
–55°C
/f
=
=
1.4
0
T
1
5
1
2
) vs f
–55°C
A
LTC1060 • TPC12
LTC1060 • TPC15
LTC1060 • TPC18
–55°C
1.0
= 25°C
1.6
1060fb
CLK
5
100
1.8
1.2


