8845A/SU 120V Fluke Electronics, 8845A/SU 120V Datasheet - Page 53
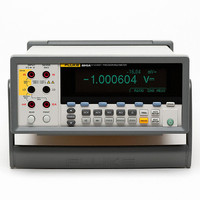
8845A/SU 120V
Manufacturer Part Number
8845A/SU 120V
Description
PREC MLTMTR DMM BNCH 6.5 DIG RES
Manufacturer
Fluke Electronics
Type
Digital (DMM)r
Specifications of 8845A/SU 120V
Includes
Test Leads
Style
Bench
Display Digits
6.5
Display Type
VFD, Dual
Display Count
Varies
Function
Voltage, Current, Resistance, Frequency
Functions, Extra
Continuity, dB, Diode Test
Features
Memory, RS-232
Ranging
Manual
Response
Average
Lead Free Status / RoHS Status
Contains lead / RoHS compliant by exemption
Other names
2675292
614-1001
614-1001


Using the Analyze Functions
Collecting Statistics on Measurements
Starting the Measurement Collection
Reading the Min, Max, Std. Dev. and Avg. Values
2. Press the MORE soft key.
3. Press the HIGH INPUT Z soft key.
The Meter is capable of performing mathematical operations with measured values, as
well as tracking a series of measurements. With the exception of Diode Test and
Continuity, all Meter functions work with all analysis functions. The mathematical
functions include statistics, limits, offset, and mX + b. Meter measurement tracking is
performed through the TrendPlot and Histogram functions.
To access the analyze functions press J.
The statistical analysis function displays the minimum and maximum measurements of a
series of Meter measurements. The Meter also calculates an average and a standard
deviation value for the same measurement series. This function also provides control over
the starting and stopping of the measurement series.
To start the statistics process:
1. Press J to display the Meter’s analysis menu.
2. Press the STATS soft key.
While a series of measurements are being collected, the process can be stopped by
pressing the STOP soft key. To start calculations on another series of measurements,
press the RESTART soft key.
As the measurements are collected, the display is continually updated with the latest
statistical data as shown below.
The minimum, maximum, average, and standard deviation is displayed along with the
number of measurements the statistics were calculated on.
The soft key label becomes highlighted to indicate high input Z is activated. Press the
soft key again to disable the function.
The Meter starts collecting data immediately. Individual readings are never stored in
the Meter, but each reading is added to the Average and Standard Deviation
calculation. At the same time, the measured value is compared to the values stored in
the minimum and maximum registers, and overwrites one of these values if it is
lower than the minimum value or greater than the maximum value.
F1
F2
F3
F4
F5
Using the Analyze Functions
Front-Panel Operation
caw03.eps
3-11