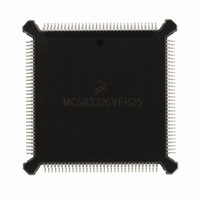
MC68332GVEH25 Freescale Semiconductor, MC68332GVEH25 Datasheet - Page 114

MC68332GVEH25
Manufacturer Part Number
MC68332GVEH25
Description
IC MCU 32BIT 25MHZ 132-PQFP
Manufacturer
Freescale Semiconductor
Series
M683xxr
Specifications of MC68332GVEH25
Core Processor
CPU32
Core Size
32-Bit
Speed
25MHz
Connectivity
EBI/EMI, SCI, SPI, UART/USART
Peripherals
POR, PWM, WDT
Number Of I /o
15
Program Memory Type
ROMless
Ram Size
2K x 8
Voltage - Supply (vcc/vdd)
4.5 V ~ 5.5 V
Oscillator Type
Internal
Operating Temperature
-40°C ~ 105°C
Package / Case
132-QFP
Processor Series
M683xx
Core
CPU32
Data Bus Width
32 bit
Controller Family/series
68K
No. Of I/o's
15
Ram Memory Size
2KB
Cpu Speed
25MHz
No. Of Timers
1
Embedded Interface Type
QSPI, SCI, UART
Digital Ic Case Style
PQFP
Rohs Compliant
Yes
Data Ram Size
2 KB
Interface Type
QSPI, SCI, UART
Maximum Clock Frequency
25 MHz
Number Of Programmable I/os
15
Number Of Timers
16
Maximum Operating Temperature
+ 105 C
Mounting Style
SMD/SMT
Minimum Operating Temperature
- 40 C
Lead Free Status / RoHS Status
Request inventory verification / Request inventory verification
Eeprom Size
-
Program Memory Size
-
Data Converters
-
Lead Free Status / Rohs Status
Lead free / RoHS Compliant
Available stocks
Company
Part Number
Manufacturer
Quantity
Price
Company:
Part Number:
MC68332GVEH25
Manufacturer:
Freescale Semiconductor
Quantity:
135
Company:
Part Number:
MC68332GVEH25
Manufacturer:
Freescale Semiconductor
Quantity:
10 000
- Current page: 114 of 265
- Download datasheet (7Mb)
5.10.2 Background Debugging Mode
5-16
Breakpoint Instruction — An emulator may insert software breakpoints into the target
Unimplemented Instruction Emulation — During instruction execution, when an at-
Microcomputer systems generally provide a debugger, implemented in software, for
system analysis at the lowest level. The background debugging mode (BDM) on the
CPU32 is unique in that the debugger has been implemented in CPU microcode.
BDM incorporates a full set of debugging options: registers can be viewed or altered,
memory can be read or written to, and test features can be invoked.
A resident debugger simplifies implementation of an in-circuit emulator. In a common
setup (see Figure 5-7), emulator hardware replaces the target system processor. A
complex, expensive pod-and-cable interface provides a communication path between
the target system and the emulator.
By contrast, an integrated debugger supports use of a bus state analyzer (BSA) for in-
circuit emulation. The processor remains in the target system (see Figure 5-8) and the
interface is simplified. The BSA monitors target processor operation and the on-chip
debugger controls the operating environment. Emulation is much “closer” to target
hardware, and many interfacing problems (e.g., limitations on high-frequency opera-
tion, AC and DC parametric mismatches, and restrictions on cable length) are mini-
mized.
causing a change in program flow. In the trace mode, a trace exception is gener-
ated after an instruction is executed, allowing a debugger program to monitor the
execution of a program under test.
code to indicate when a breakpoint has occurred. On the MC68010, MC68020,
MC68030, and CPU32, this function is provided via illegal instructions, $4848–
$484F, to serve as breakpoint instructions.
tempt is made to execute an illegal instruction, an illegal instruction exception oc-
curs. Unimplemented instructions (F-line, A-line,...) utilize separate exception
vectors to permit efficient emulation of unimplemented instructions in software.
TARGET
SYSTEM
Figure 5-7 Common in-Circuit Emulator Diagram
Freescale Semiconductor, Inc.
For More Information On This Product,
CENTRAL PROCESSING UNIT
Go to: www.freescale.com
IN-CIRCUIT
EMULATOR
TARGET
MCU
USER’S MANUAL
1128A
MC68332
Related parts for MC68332GVEH25
Image
Part Number
Description
Manufacturer
Datasheet
Request
R
Part Number:
Description:
Manufacturer:
Freescale Semiconductor, Inc
Datasheet:
Part Number:
Description:
Manufacturer:
Freescale Semiconductor, Inc
Datasheet:
Part Number:
Description:
Manufacturer:
Freescale Semiconductor, Inc
Datasheet:
Part Number:
Description:
Manufacturer:
Freescale Semiconductor, Inc
Datasheet:
Part Number:
Description:
Manufacturer:
Freescale Semiconductor, Inc
Datasheet:
Part Number:
Description:
Manufacturer:
Freescale Semiconductor, Inc
Datasheet:
Part Number:
Description:
Manufacturer:
Freescale Semiconductor, Inc
Datasheet:
Part Number:
Description:
Manufacturer:
Freescale Semiconductor, Inc
Datasheet:
Part Number:
Description:
Manufacturer:
Freescale Semiconductor, Inc
Datasheet:
Part Number:
Description:
Manufacturer:
Freescale Semiconductor, Inc
Datasheet:
Part Number:
Description:
Manufacturer:
Freescale Semiconductor, Inc
Datasheet:
Part Number:
Description:
Manufacturer:
Freescale Semiconductor, Inc
Datasheet:
Part Number:
Description:
Manufacturer:
Freescale Semiconductor, Inc
Datasheet:
Part Number:
Description:
Manufacturer:
Freescale Semiconductor, Inc
Datasheet:
Part Number:
Description:
Manufacturer:
Freescale Semiconductor, Inc
Datasheet:


