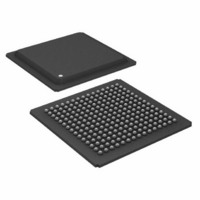
ADSP-21062LABZ-160 Analog Devices Inc, ADSP-21062LABZ-160 Datasheet - Page 8

ADSP-21062LABZ-160
Manufacturer Part Number
ADSP-21062LABZ-160
Description
IC,DSP,32-BIT,CMOS,BGA,225PIN,PLASTIC
Manufacturer
Analog Devices Inc
Series
SHARC®r
Type
Floating Pointr
Specifications of ADSP-21062LABZ-160
Interface
Host Interface, Link Port, Serial Port
Clock Rate
40MHz
Non-volatile Memory
External
On-chip Ram
256kB
Voltage - I/o
3.30V
Voltage - Core
3.30V
Operating Temperature
-40°C ~ 85°C
Mounting Type
Surface Mount
Package / Case
225-BGA
Package
225BGA
Numeric And Arithmetic Format
Floating-Point
Maximum Speed
40 MHz
Ram Size
256 KB
Device Million Instructions Per Second
40 MIPS
Lead Free Status / RoHS Status
Lead free / RoHS Compliant
Available stocks
Company
Part Number
Manufacturer
Quantity
Price
Company:
Part Number:
ADSP-21062LABZ-160
Manufacturer:
SAMSUNG
Quantity:
591
Company:
Part Number:
ADSP-21062LABZ-160
Manufacturer:
Analog Devices Inc
Quantity:
10 000
ADSP-21060/ADSP-21060L/ADSP-21062/ADSP-21062L/ADSP-21060C/ADSP-21060LC
Link Ports
The ADSP-2106x features six 4-bit link ports that provide addi-
tional I/O capabilities. The link ports can be clocked twice per
cycle, allowing each to transfer eight bits of data per cycle. Link-
port I/O is especially useful for point-to-point interprocessor
communication in multiprocessing systems.
The link ports can operate independently and simultaneously,
with a maximum data throughput of 240M bytes/s. Link port
data is packed into 32- or 48-bit words, and can be directly read
by the core processor or DMA-transferred to on-chip memory.
Each link port has its own double-buffered input and output
registers. Clock/acknowledge handshaking controls link port
transfers. Transfers are programmable as either transmit or
receive.
Program Booting
The internal memory of the ADSP-2106x can be booted at sys-
tem power-up from an 8-bit EPROM, a host processor, or
through one of the link ports. Selection of the boot source is
controlled by the BMS (boot memory select), EBOOT (EPROM
Boot), and LBOOT (link/host boot) pins. 32-bit and 16-bit host
processors can be used for booting. The processor also sup-
ports a no-boot mode in which instruction execution is sourced
from the external memory.
DEVELOPMENT TOOLS
The ADSP-2106x is supported by a complete set of
CROSSCORE
Devices emulators and VisualDSP++
ment. The same emulator hardware that supports other SHARC
processors also fully emulates the ADSP-2106x.
The VisualDSP++ project management environment lets pro-
grammers develop and debug an application. This environment
includes an easy to use assembler (which is based on an alge-
braic syntax), an archiver (librarian/library builder), a linker, a
loader, a cycle-accurate instruction-level simulator, a C/C++
compiler, and a C/C++ runtime library that includes DSP and
mathematical functions. A key point for these tools is C/C++
code efficiency. The compiler has been developed for efficient
translation of C/C++ code to DSP assembly. The ADSP-2106x
SHARC DSP has architectural features that improve the effi-
ciency of compiled C/C++ code.
The VisualDSP++ debugger has a number of important fea-
tures. Data visualization is enhanced by a plotting package that
offers a significant level of flexibility. This graphical representa-
tion of user data enables the programmer to quickly determine
the performance of an algorithm. As algorithms grow in com-
plexity, this capability can have increasing significance on the
designer’s development schedule, increasing productivity. Sta-
tistical profiling enables the programmer to nonintrusively poll
the processor as it is running the program. This feature, unique
to VisualDSP++, enables the software developer to passively
gather important code execution metrics without interrupting
†
‡
CROSSCORE is a registered trademark of Analog Devices, Inc.
VisualDSP++ is a registered trademark of Analog Devices, Inc.
®†
software development tools, including Analog
®‡
development environ-
Rev. F | Page 8 of 64 | March 2008
the real-time characteristics of the program. Essentially, the
developer can identify bottlenecks in software quickly and effi-
ciently. By using the profiler, the programmer can focus on
those areas in the program that impact performance and take
corrective action.
Debugging both C/C++ and assembly programs with the
VisualDSP++ debugger, programmers can:
The VisualDSP++ IDDE lets programmers define and manage
DSP software development. Its dialog boxes and property pages
let programmers configure and manage all of the ADSP-2106x
development tools, including the color syntax highlighting in
the VisualDSP++ editor. This capability permits:
The VisualDSP++ kernel (VDK) incorporates scheduling and
resource management tailored specifically to address the mem-
ory and timing constraints of DSP programming. These
capabilities enable engineers to develop code more effectively,
eliminating the need to start from the very beginning when
developing new application code. The VDK features include
threads, critical and unscheduled regions, semaphores, events,
and device flags. The VDK also supports priority-based, pre-
emptive, cooperative, and time-sliced scheduling approaches. In
addition, the VDK was designed to be scalable. If the application
does not use a specific feature, the support code for that feature
is excluded from the target system.
Because the VDK is a library, a developer can decide whether to
use it or not. The VDK is integrated into the VisualDSP++
development environment, but can also be used via standard
command line tools. When the VDK is used, the development
environment assists the developer with many error-prone tasks
and assists in managing system resources, automating the gen-
eration of various VDK-based objects, and visualizing the
system state, when debugging an application that uses the VDK.
Use the expert linker to visually manipulate the placement of
code and data on the embedded system. View memory utiliza-
tion in a color-coded graphical form, easily move code and data
to different areas of the DSP or external memory with a drag of
the mouse, and examine run-time stack and heap usage. The
• View mixed C/C++ and assembly code (interleaved source
• Insert breakpoints
• Set conditional breakpoints on registers, memory, and
• Trace instruction execution
• Perform linear or statistical profiling of program execution
• Fill, dump, and graphically plot the contents of memory
• Perform source level debugging
• Create custom debugger windows
• Control in how the development tools process inputs and
• Maintenance of a one-to-one correspondence with the
and object information)
stacks
generate outputs
tools’ command line switches


