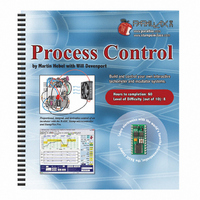
122-28176 Parallax Inc, 122-28176 Datasheet - Page 53

122-28176
Manufacturer Part Number
122-28176
Description
GUIDE STUDENT PROCESS CONTROL
Manufacturer
Parallax Inc
Specifications of 122-28176
Accessory Type
Manual
Product
Microcontroller Accessories
Lead Free Status / RoHS Status
Contains lead / RoHS non-compliant
For Use With/related Products
Propeller Education (PE) Kit
Lead Free Status / RoHS Status
Lead free / RoHS Compliant, Contains lead / RoHS non-compliant
- Current page: 53 of 330
- Download datasheet (11Mb)
CONCLUSION
Computer based software is useful for data acquisition and control of a system. It allows
the operator to note current conditions, perform trend analysis, collect data to files, and
update system settings. StampPlot is specialized software designed for the BASIC Stamp
for this purpose.
StampPlot allows the real-time acquisition and plotting of analog and digital data.
Furthermore, it provides both specialized interfaces as in virtual instruments to view data,
and interactive control with the BASIC Stamp. Data strings from the BASIC Stamp can
be used to send analog data, send digital data, control StampPlot, or send messages to the
user. StampPlot also provides means to log data, messages and images to file for later
analysis and review.
SOLUTIONS TO CHAPTER 2 CHALLENGES
Challenge 2-1 Solution
Challenge 2-3 Solutions
5. Plot the light level and select to stop the plot at maximum. About halfway
1. The Y-Axis is set to values of 0 and 2000.
2. The pushbutton value is plotted as a blue trace at the top of the plot. It changes
1. Use the right drop-down box below the toolbar at top to set a range. Manually
2. As in number 1, enter values for range and time in the top drop-down boxes and
through, fully darken the light falling on the sensor. Once stopped, annotate the
plot with text about what occurred at that point.
between 2 states, high and low for binary values.
enter 0,30 and tab-off to set. The right + and – buttons may also be used to
adjust. Use the left drop-down box below the toolbar at top to set a range.
Manually enter 500,1000 and tab-off to set. The left + and – buttons may also be
used to adjust. To reset after 30 seconds, turn off the shift button on the toolbar
at top.
tab-off. To stop the plot, the 'Stop' button on the toolbar should be on
(depressed).
connecting again or it will stop once again.
After being stopped, the plot will need to be reset prior to
Related parts for 122-28176
Image
Part Number
Description
Manufacturer
Datasheet
Request
R

Part Number:
Description:
MANUAL FOR SUMOBOT
Manufacturer:
Parallax Inc
Datasheet:

Part Number:
Description:
GUIDE STUDENT SMART SENSORS
Manufacturer:
Parallax Inc
Datasheet:

Part Number:
Description:
MANUAL PROPELLER
Manufacturer:
Parallax Inc
Datasheet:

Part Number:
Description:
LEAD WIRES FLYING CABLE III/IV
Manufacturer:
Xilinx Inc
Datasheet:

Part Number:
Description:
BOARD ADAPTER AND FLY LEADS
Manufacturer:
Xilinx Inc
Datasheet:

Part Number:
Description:
PLATFORM CABLE USB II
Manufacturer:
Xilinx Inc
Datasheet:

Part Number:
Description:
KIT STARTER COOLRUNNER-II BUNDLE
Manufacturer:
Xilinx Inc
Datasheet:

Part Number:
Description:
Microcontroller Modules & Accessories DISCONTINUED BY PARALLAX
Manufacturer:
Parallax Inc

Part Number:
Description:
Microcontroller Modules & Accessories DISCONTINUED BY PARALLAX
Manufacturer:
Parallax Inc

Part Number:
Description:
BOOK UNDERSTANDING SIGNALS
Manufacturer:
Parallax Inc
Datasheet:

Part Number:
Description:
BOARD EXPERIMENT+LCD NX-1000
Manufacturer:
Parallax Inc
Datasheet:

Part Number:
Description:
IC MCU 2K FLASH 50MHZ SO-18
Manufacturer:
Parallax Inc
Datasheet:


