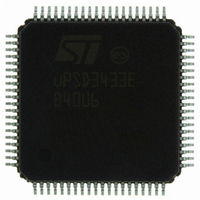
UPSD3433EB40U6 STMicroelectronics, UPSD3433EB40U6 Datasheet - Page 50

UPSD3433EB40U6
Manufacturer Part Number
UPSD3433EB40U6
Description
MCU 8BIT 8032 128KB FLASH 80TQFP
Manufacturer
STMicroelectronics
Series
µPSDr
Datasheet
1.UPSD3434EB40T6.pdf
(293 pages)
Specifications of UPSD3433EB40U6
Core Processor
8032
Core Size
8-Bit
Speed
40MHz
Connectivity
I²C, IrDA, SPI, UART/USART, USB
Peripherals
LVD, POR, PWM, WDT
Number Of I /o
46
Program Memory Size
160KB (160K x 8)
Program Memory Type
FLASH
Ram Size
8K x 8
Voltage - Supply (vcc/vdd)
3 V ~ 5.5 V
Data Converters
A/D 8x10b
Oscillator Type
Internal
Operating Temperature
-40°C ~ 85°C
Package / Case
80-TQFP, 80-VQFP
For Use With
497-5518 - EVAL BOARD RFID READER497-5046 - KIT TOOL FOR ST7/UPSD/STR7 MCU
Lead Free Status / RoHS Status
Lead free / RoHS Compliant
Eeprom Size
-
Other names
497-5660
Available stocks
Company
Part Number
Manufacturer
Quantity
Price
Company:
Part Number:
UPSD3433EB40U6
Manufacturer:
STMicroelectronics
Quantity:
10 000
- Current page: 50 of 293
- Download datasheet (5Mb)
Debug unit
12
50/293
Debug unit
The 8032 MCU Module supports run-time debugging through the JTAG interface. This same
JTAG interface is also used for In-System Programming (ISP) and the physical connections
are described in the PSD Module section,
page
Debugging with a serial interface such as JTAG is a non-intrusive way to gain access to the
internal state of the 8032 MCU core and various memories. A traditional external hardware
emulator cannot be completely effective on the uPSD34xx because of the Pre-Fetch Queue
and Branch Cache. The nature of the PFQ and BC hide the visibility of actual program flow
through traditional external bus connections, thus requiring on-chip serial debugging
instead.
Debugging is supported by Windows PC based software tools used for 8051 code
development from 3rd party vendors listed at www.st.com/psm. Debug capabilities include:
●
●
●
●
●
●
●
●
Some key points regarding use of the JTAG Debugger.
Halt or Start MCU execution
Reset the MCU
Single Step
3 Match Breakpoints
1 Range Breakpoint (inside or outside range)
Program Tracing
Read or Modify MCU core registers, DATA, IDATA, SFR, XDATA, and Code
External Debug Event Pin, Input or Output
–
–
–
–
–
–
251.
The JTAG Debugger can access MCU registers, data memory, and code memory
while the MCU is executing at full speed by cycle-stealing. This means “watch
windows” may be displayed and periodically updated on the PC during full speed
operation. Registers and data content may also be modified during full speed
operation.
There is no on-chip storage for Program Trace data, but instead this data is
scanned from the uPSD34xx through the JTAG channel at run-time to the PC host
for proccessing. As such, full speed program tracing is possible only when the
8032 MCU is operating below approximately one MIPS of performance. Above
one MIPS, the program will not run real-time while tracing. One MIPS performance
is determined by the combination of choice for MCU clock frequency, and the bit
settings in SFR registers BUSCON and CCON0.
Breakpoints can optionally halt the MCU, and/or assert the external Debug Event
pin.
Breakpoint definitions may be qualified with read or write operations, and may also
be qualified with an address of code, SFR, DATA, IDATA, or XDATA memories.
Three breakpoints will compare an address, but the fourth breakpoint can
compare an address and also data content. Additionally, the fouth breakpoint can
be logically combined (AND/OR) with any of the other three breakpoints.
The Debug Event pin can be configured by the PC host to generate an output
pulse for external triggering when a break condition is met. The pin can also be
configured as an event input to the breakpoint logic, causing a break on the falling-
edge of an external event signal. If not used, the Debug Event pin should be pulled
Section 28.6.1: JTAG ISP and JTAG debug on
uPSD34xx
Related parts for UPSD3433EB40U6
Image
Part Number
Description
Manufacturer
Datasheet
Request
R

Part Number:
Description:
MCU 8BIT 8032 128KB FLASH 80TQFP
Manufacturer:
STMicroelectronics
Datasheet:

Part Number:
Description:
MCU 8BIT 8032 128KB FLASH 52TQFP
Manufacturer:
STMicroelectronics
Datasheet:

Part Number:
Description:
STMicroelectronics [RIPPLE-CARRY BINARY COUNTER/DIVIDERS]
Manufacturer:
STMicroelectronics
Datasheet:

Part Number:
Description:
STMicroelectronics [LIQUID-CRYSTAL DISPLAY DRIVERS]
Manufacturer:
STMicroelectronics
Datasheet:

Part Number:
Description:
BOARD EVAL FOR MEMS SENSORS
Manufacturer:
STMicroelectronics
Datasheet:

Part Number:
Description:
NPN TRANSISTOR POWER MODULE
Manufacturer:
STMicroelectronics
Datasheet:

Part Number:
Description:
TURBOSWITCH ULTRA-FAST HIGH VOLTAGE DIODE
Manufacturer:
STMicroelectronics
Datasheet:

Part Number:
Description:
Manufacturer:
STMicroelectronics
Datasheet:

Part Number:
Description:
DIODE / SCR MODULE
Manufacturer:
STMicroelectronics
Datasheet:

Part Number:
Description:
DIODE / SCR MODULE
Manufacturer:
STMicroelectronics
Datasheet:

Part Number:
Description:
Search -----> STE16N100
Manufacturer:
STMicroelectronics
Datasheet:

Part Number:
Description:
Search ---> STE53NA50
Manufacturer:
STMicroelectronics
Datasheet:


