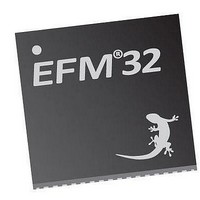
EFM32TG210F32 Energy Micro, EFM32TG210F32 Datasheet - Page 23

EFM32TG210F32
Manufacturer Part Number
EFM32TG210F32
Description
MCU 32BIT 32KB FLASH 32-QFN
Manufacturer
Energy Micro
Series
Tiny Geckor
Specifications of EFM32TG210F32
Core Processor
ARM® Cortex-M3™
Core Size
32-Bit
Speed
32MHz
Connectivity
EBI/EMI, I²C, IrDA, SmartCard, SPI, UART/USART
Peripherals
Brown-out Detect/Reset, DMA, POR, PWM, WDT
Number Of I /o
24
Program Memory Size
32KB (32K x 8)
Program Memory Type
FLASH
Ram Size
4K x 8
Voltage - Supply (vcc/vdd)
1.8 V ~ 3.8 V
Data Converters
A/D 4x12b, D/A 1x12b
Oscillator Type
External
Operating Temperature
-40°C ~ 85°C
Package / Case
32-VQFN Exposed Pad
Processor Series
EFM32
Core
ARM Cortex-M3
Data Bus Width
32 bit
Data Ram Size
32 KB
Interface Type
UART, I2C, SPI
Maximum Clock Frequency
32 MHz
Number Of Programmable I/os
17
Number Of Timers
1
Operating Supply Voltage
1.8 V to 3.8 V
Maximum Operating Temperature
+ 85 C
Mounting Style
SMD/SMT
Processor To Be Evaluated
EFM32TG210
Lead Free Status / RoHS Status
Lead free / RoHS Compliant
Eeprom Size
-
Lead Free Status / Rohs Status
Details
- Current page: 23 of 522
- Download datasheet (9Mb)
6 DBG - Debug Interface
6.1 Introduction
6.2 Features
6.3 Functional Description
6.4 Debug Lock and Device Erase
2010-12-21 - d0034_Rev0.90
The EFM32TG devices include hardware debug support through a 2-pin serial-wire debug interface. In
addition there is also a 1-wire Serial Wire Viewer pin which can be used to output profiling information,
data trace and software-generated messages.
• Flash Patch and Breakpoint (FPB) unit
• Data Watch point and Trace (DWT) unit
• Instrumentation Trace Macrocell (ITM)
There are three debug pins on the device, which also can be used as GPIO. The three debug pins are:
• SWCLK Serial Wire Clock input. This pin is enabled after reset and has a built-in pull down.
• SWDIO Serial Wire data Input/Output. This pin is enabled after a reset and has a built in pull-up.
• SWO Serial Wire Viewer Output. This pin is disabled after a reset.
For more information on how to enable the debug pin outputs/inputs the reader is referred to
Section 28.3.4.1 (p. 453) , the ARM Cortex-M3 Technical Reference Manual and the ARM CoreSight
Technical Reference Manual
The debug access to the Cortex-M3 is locked by clearing the Debug Lock Word (DLW), see
Section 7.3.2 (p. 29)
0 1 2 3
• Implement breakpoints and code patches
• Implement watch points, trigger resources, and system profiling
• Application-driven trace source that supports printf style debugging
ARM Cor t e x- M 3
4
DBG
De bu g Da t a
...the world's most energy friendly microcontrollers
23
What?
The DBG (Debug Interface) is used to
program and debug EFM32TG devices.
Why?
The Debug Interface makes it easy to re-
program and update the system in field, and
allows debugging with minimal I/O pin use.
How?
The Cortex-M3 supports advanced
debugging features. EFM32TG devices
only use two port pins for debugging or
programming. The systems internal and
external state can be examined with debug
extensions supporting instruction or data
access break- and watch points.
Quick Facts
www.energymicro.com
Related parts for EFM32TG210F32
Image
Part Number
Description
Manufacturer
Datasheet
Request
R

Part Number:
Description:
KIT STARTER EFM32 GECKO
Manufacturer:
Energy Micro
Datasheet:

Part Number:
Description:
KIT DEV EFM32 GECKO LCD SUPPORT
Manufacturer:
Energy Micro
Datasheet:

Part Number:
Description:
BOARD PROTOTYPING FOR EFM32
Manufacturer:
Energy Micro
Datasheet:

Part Number:
Description:
KIT DEVELOPMENT EFM32 GECKO
Manufacturer:
Energy Micro
Datasheet:

Part Number:
Description:
MCU, MPU & DSP Development Tools TG840 Sample Kit
Manufacturer:
Energy Micro
Datasheet:

Part Number:
Description:
MCU, MPU & DSP Development Tools TG Starter Kit
Manufacturer:
Energy Micro
Datasheet:

Part Number:
Description:
MCU, MPU & DSP Development Tools TG108 Sample Kit
Manufacturer:
Energy Micro

Part Number:
Description:
MCU, MPU & DSP Development Tools TG210 Sample Kit
Manufacturer:
Energy Micro
Datasheet:

Part Number:
Description:
MCU, MPU & DSP Development Tools TG822 Sample Kit
Manufacturer:
Energy Micro
Datasheet:

Part Number:
Description:
MCU, MPU & DSP Development Tools TG230 Sample Kit
Manufacturer:
Energy Micro

Part Number:
Description:
SAMPLE KIT (SMALL BOX - CONTAINING 2 DEVICES)
Manufacturer:
Energy Micro

Part Number:
Description:
SAMPLE KIT (SMALL BOX - CONTAINING 2 DEVICES)
Manufacturer:
Energy Micro


